Although Wabtec (currently trading at $203.18 per share) has gained 25.9% over the last six months, it has trailed the S&P 500’s 33.2% return during that period. This was partly due to its softer quarterly results and may have investors wondering how to approach the situation.
Given the relatively weaker price action, is now a good time to buy WAB? Or are investors better off allocating their money elsewhere?
Why Does WAB Stock Spark Debate?
Also known as Wabtec, Westinghouse Air Brake Technologies (NYSE: WAB) provides equipment, systems, and related software for the railway industry.
Two Positive Attributes:
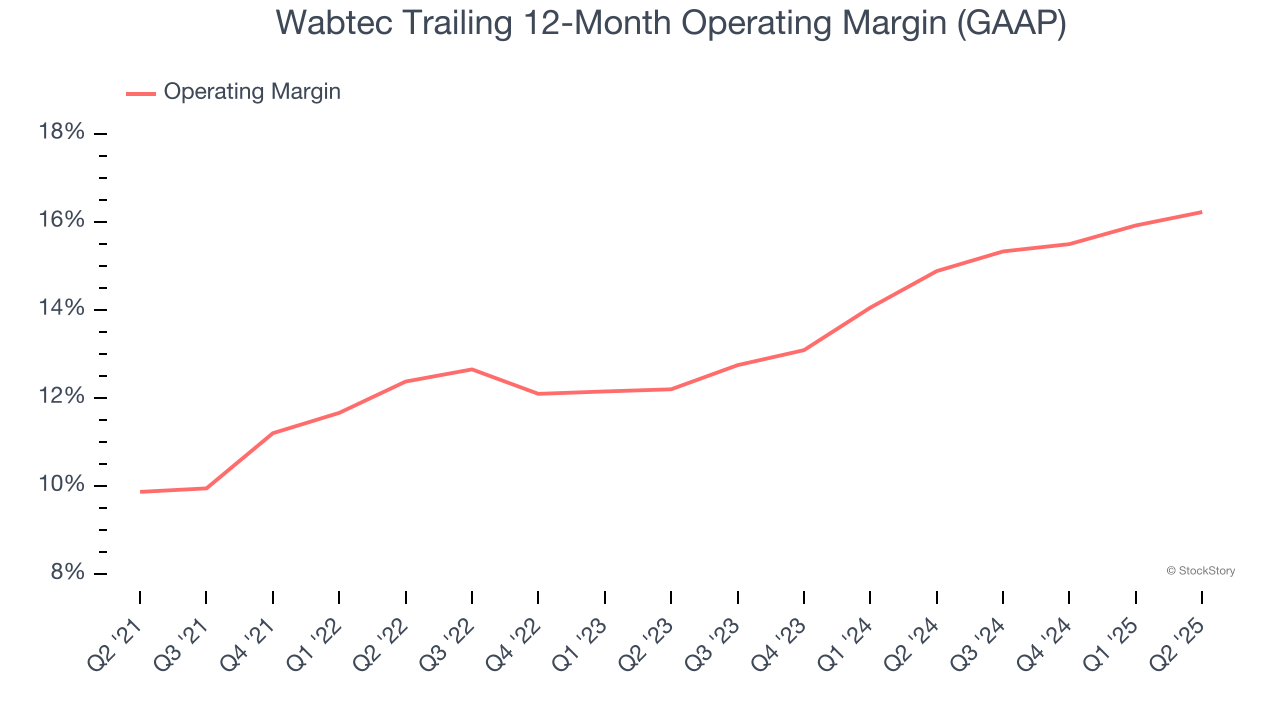
1. Operating Margin Rising, Profits Up
Operating margin is one of the best measures of profitability because it tells us how much money a company takes home after procuring and manufacturing its products, marketing and selling those products, and most importantly, keeping them relevant through research and development.
Analyzing the trend in its profitability, Wabtec’s operating margin rose by 6.4 percentage points over the last five years, as its sales growth gave it operating leverage. Its operating margin for the trailing 12 months was 16.2%.
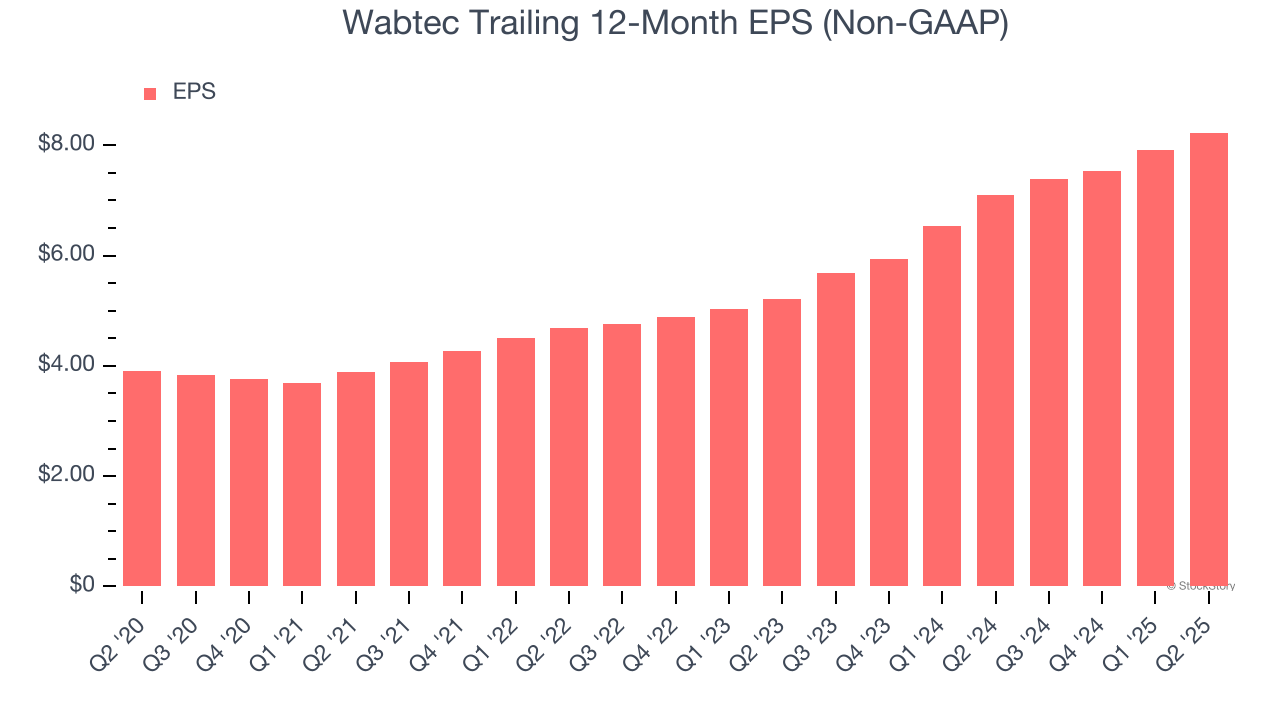
2. Outstanding Long-Term EPS Growth
We track the long-term change in earnings per share (EPS) because it highlights whether a company’s growth is profitable.
Wabtec’s EPS grew at a spectacular 16% compounded annual growth rate over the last five years, higher than its 5.6% annualized revenue growth. This tells us the company became more profitable on a per-share basis as it expanded.
One Reason to be Careful:
Slow Organic Growth Suggests Waning Demand In Core Business
We can better understand Heavy Transportation Equipment companies by analyzing their organic revenue. This metric gives visibility into Wabtec’s core business because it excludes one-time events such as mergers, acquisitions, and divestitures along with foreign currency fluctuations - non-fundamental factors that can manipulate the income statement.
Over the last two years, Wabtec’s organic revenue averaged 7.5% year-on-year growth. This performance slightly lagged the sector and suggests it may need to improve its products, pricing, or go-to-market strategy, which can add an extra layer of complexity to its operations. 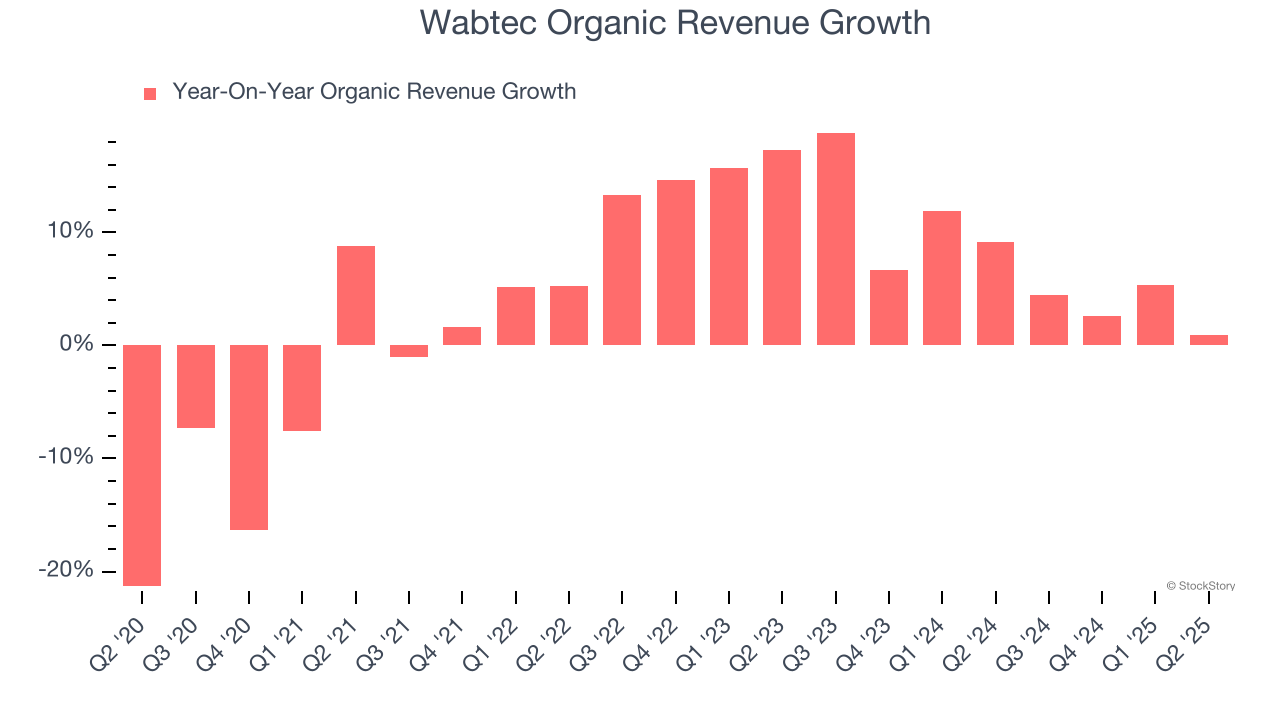
Final Judgment
Wabtec has huge potential even though it has some open questions. With its shares trailing the market in recent months, the stock trades at 28× forward EV-to-EBITDA (or $203.18 per share). Is now a good time to initiate a position? See for yourself in our comprehensive research report, it’s free for active Edge members .
Stocks We Like Even More Than Wabtec
When Trump unveiled his aggressive tariff plan in April 2025, markets tanked as investors feared a full-blown trade war. But those who panicked and sold missed the subsequent rebound that’s already erased most losses.
Don’t let fear keep you from great opportunities and take a look at Top 6 Stocks for this week. This is a curated list of our High Quality stocks that have generated a market-beating return of 183% over the last five years (as of March 31st 2025).
Stocks that made our list in 2020 include now familiar names such as Nvidia (+1,545% between March 2020 and March 2025) as well as under-the-radar businesses like the once-micro-cap company Tecnoglass (+1,754% five-year return). Find your next big winner with StockStory today.
StockStory is growing and hiring equity analyst and marketing roles. Are you a 0 to 1 builder passionate about the markets and AI? See the open roles here.