Over the past six months, Kimberly-Clark’s stock price fell to $120.77. Shareholders have lost 10.2% of their capital, which is disappointing considering the S&P 500 has climbed by 33.2%. This might have investors contemplating their next move.
Is now the time to buy Kimberly-Clark, or should you be careful about including it in your portfolio? See what our analysts have to say in our full research report, it’s free for active Edge members.
Why Is Kimberly-Clark Not Exciting?
Even with the cheaper entry price, we're sitting this one out for now. Here are three reasons we avoid KMB and a stock we'd rather own.
1. Slow Organic Growth Suggests Waning Demand In Core Business
When analyzing revenue growth, we care most about organic revenue growth. This metric captures a business’s performance excluding one-time events such as mergers, acquisitions, and divestitures as well as foreign currency fluctuations.
The demand for Kimberly-Clark’s products has generally risen over the last two years but lagged behind the broader sector. On average, the company’s organic sales have grown by 3% year on year. 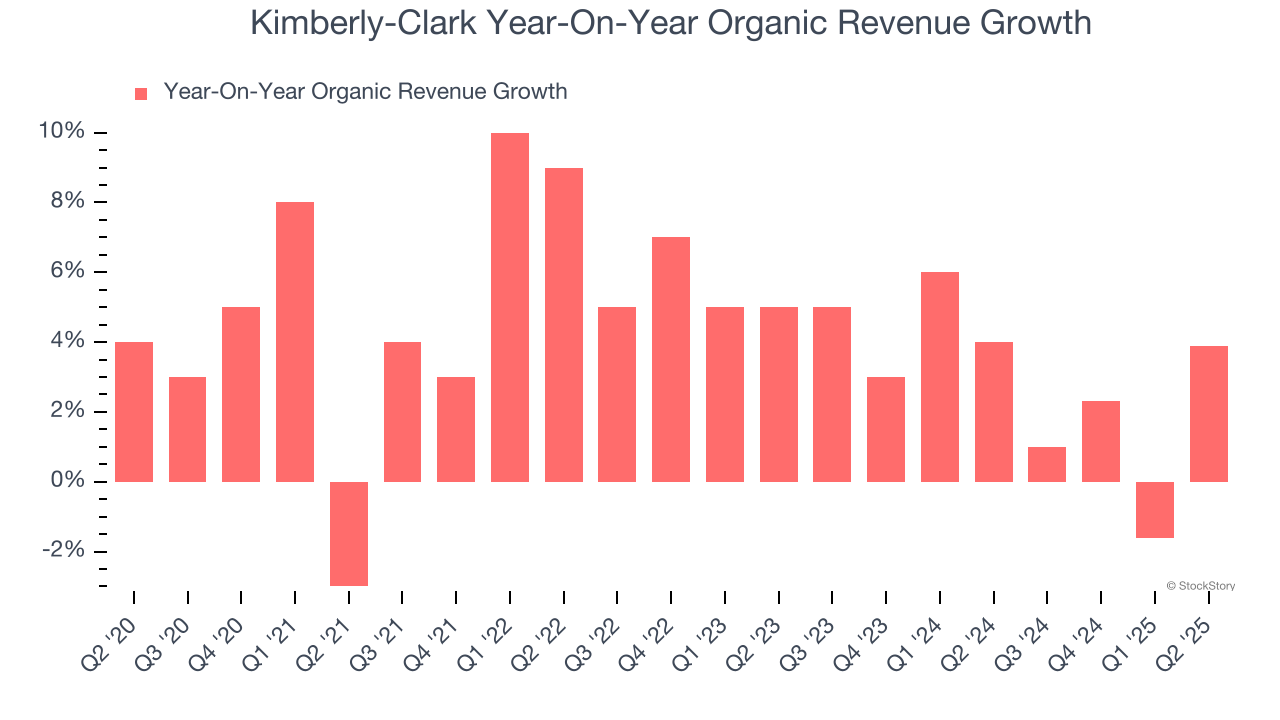
2. Projected Revenue Growth Is Slim
Forecasted revenues by Wall Street analysts signal a company’s potential. Predictions may not always be accurate, but accelerating growth typically boosts valuation multiples and stock prices while slowing growth does the opposite.
Over the next 12 months, sell-side analysts expect Kimberly-Clark’s revenue to rise by 2.2%. While this projection suggests its newer products will spur better top-line performance, it is still below average for the sector.
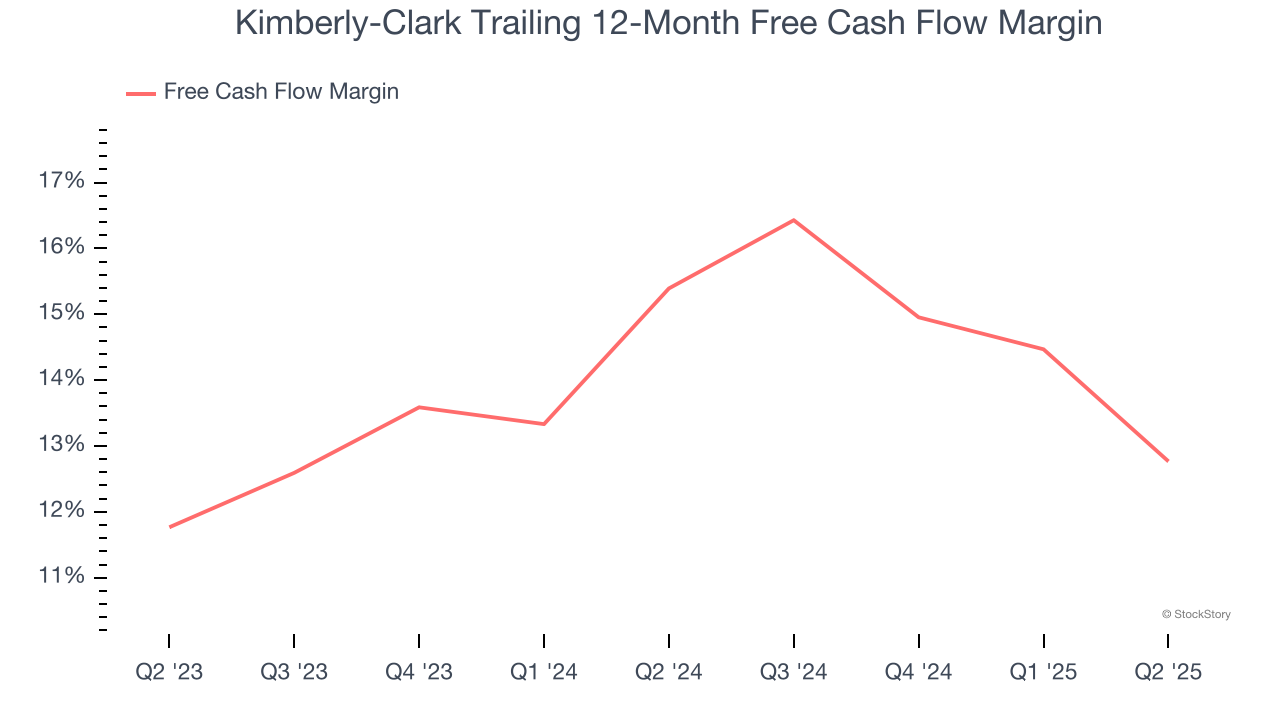
3. Free Cash Flow Margin Dropping
If you’ve followed StockStory for a while, you know we emphasize free cash flow. Why, you ask? We believe that in the end, cash is king, and you can’t use accounting profits to pay the bills.
As you can see below, Kimberly-Clark’s margin dropped by 2.6 percentage points over the last year. If its declines continue, it could signal increasing investment needs and capital intensity. Kimberly-Clark’s free cash flow margin for the trailing 12 months was 12.8%.
Final Judgment
Kimberly-Clark isn’t a terrible business, but it doesn’t pass our bar. Following the recent decline, the stock trades at 16.2× forward P/E (or $120.77 per share). This valuation multiple is fair, but we don’t have much faith in the company. We're pretty confident there are superior stocks to buy right now. Let us point you toward one of our top software and edge computing picks.
Stocks We Would Buy Instead of Kimberly-Clark
When Trump unveiled his aggressive tariff plan in April 2025, markets tanked as investors feared a full-blown trade war. But those who panicked and sold missed the subsequent rebound that’s already erased most losses.
Don’t let fear keep you from great opportunities and take a look at Top 6 Stocks for this week. This is a curated list of our High Quality stocks that have generated a market-beating return of 183% over the last five years (as of March 31st 2025).
Stocks that made our list in 2020 include now familiar names such as Nvidia (+1,545% between March 2020 and March 2025) as well as under-the-radar businesses like the once-small-cap company Comfort Systems (+782% five-year return). Find your next big winner with StockStory today.
StockStory is growing and hiring equity analyst and marketing roles. Are you a 0 to 1 builder passionate about the markets and AI? See the open roles here.