
What a fantastic six months it’s been for Warby Parker. Shares of the company have skyrocketed 71.7%, hitting $24.50. This was partly due to its solid quarterly results, and the performance may have investors wondering how to approach the situation.
Is now still a good time to buy WRBY? Or is this a case of a company fueled by heightened investor enthusiasm? Find out in our full research report, it’s free for active Edge members.
Why Does Warby Parker Spark Debate?
Founded in 2010, Warby Parker (NYSE: WRBY) designs, manufactures, and sells eyewear, including prescription glasses, sunglasses, and contact lenses, through its e-commerce platform and physical retail locations.
Two Positive Attributes:
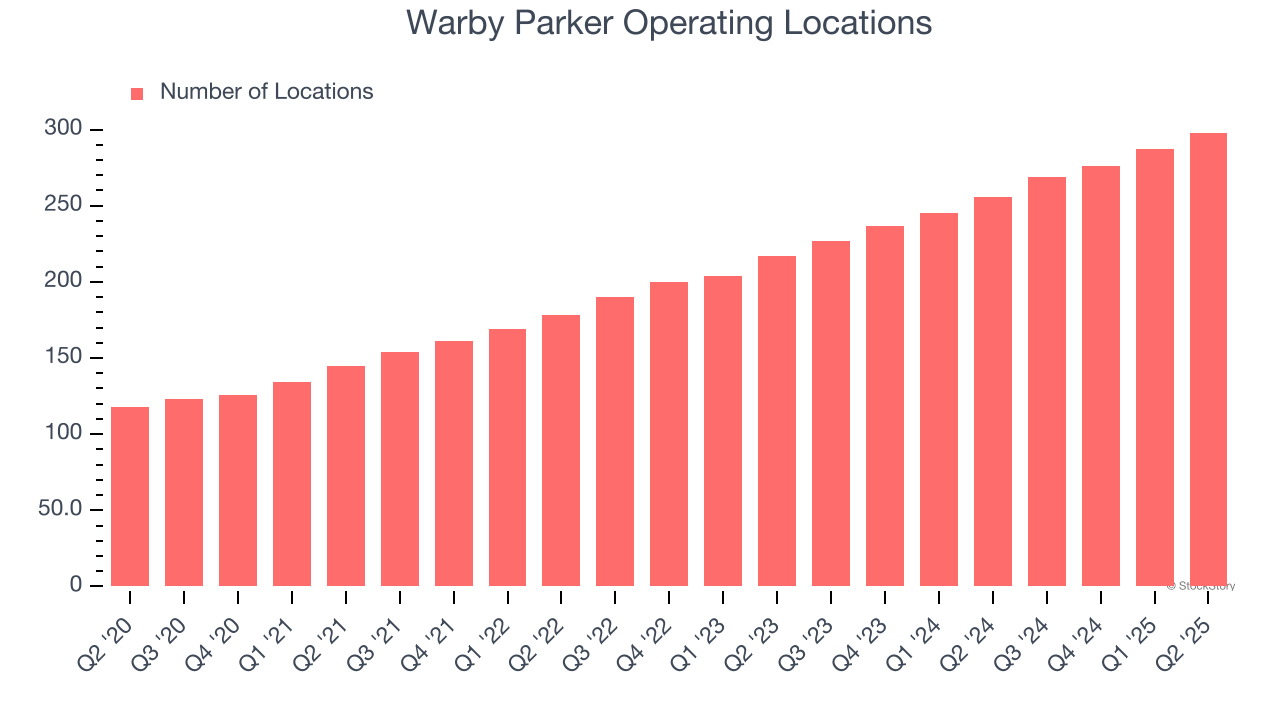
1. New Stores Opening at Breakneck Speed
A retailer’s store count often determines how much revenue it can generate.
Warby Parker sported 298 locations in the latest quarter. Over the last two years, it has opened new stores at a rapid clip by averaging 18.1% annual growth, among the fastest in the consumer retail sector. This gives it a chance to scale into a mid-sized business over time.
When a retailer opens new stores, it usually means it’s investing for growth because demand is greater than supply, especially in areas where consumers may not have a store within reasonable driving distance.
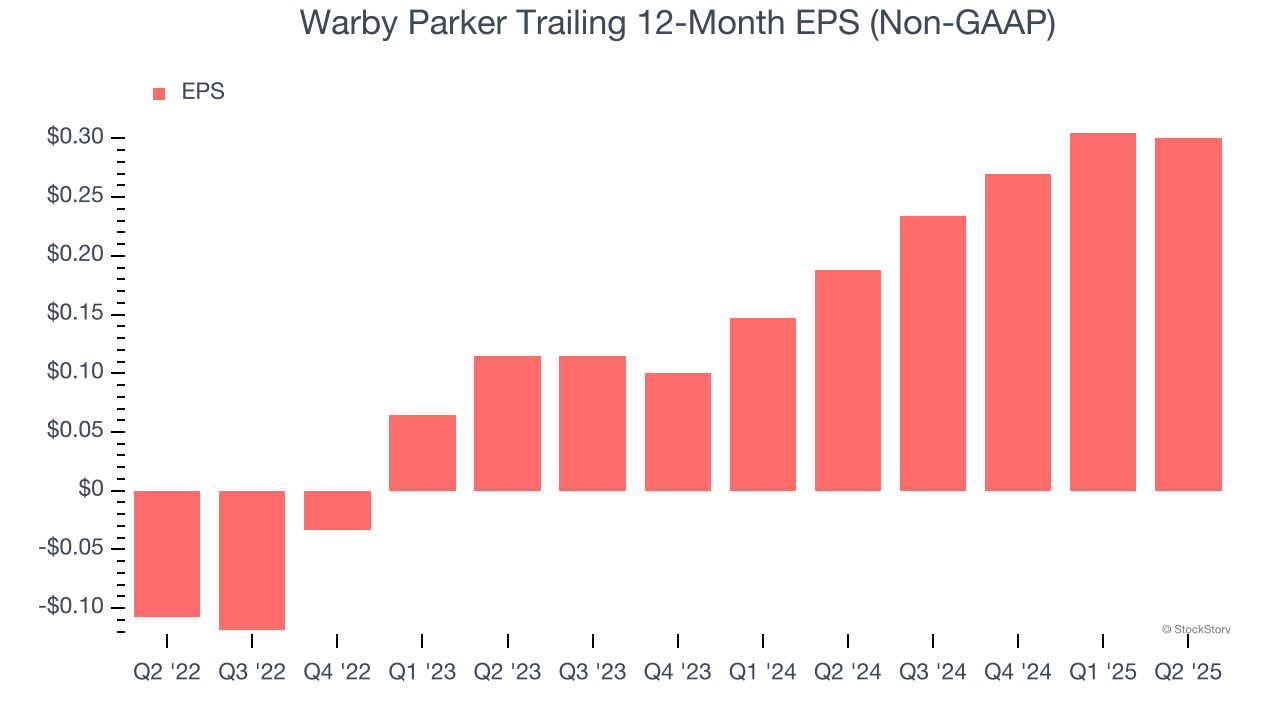
2. Outstanding Long-Term EPS Growth
We track the change in earnings per share (EPS) because it highlights whether a company’s growth is profitable.
Warby Parker’s full-year EPS flipped from negative to positive over the last three years. This is a good sign and shows it’s at an inflection point.
One Reason to be Careful:
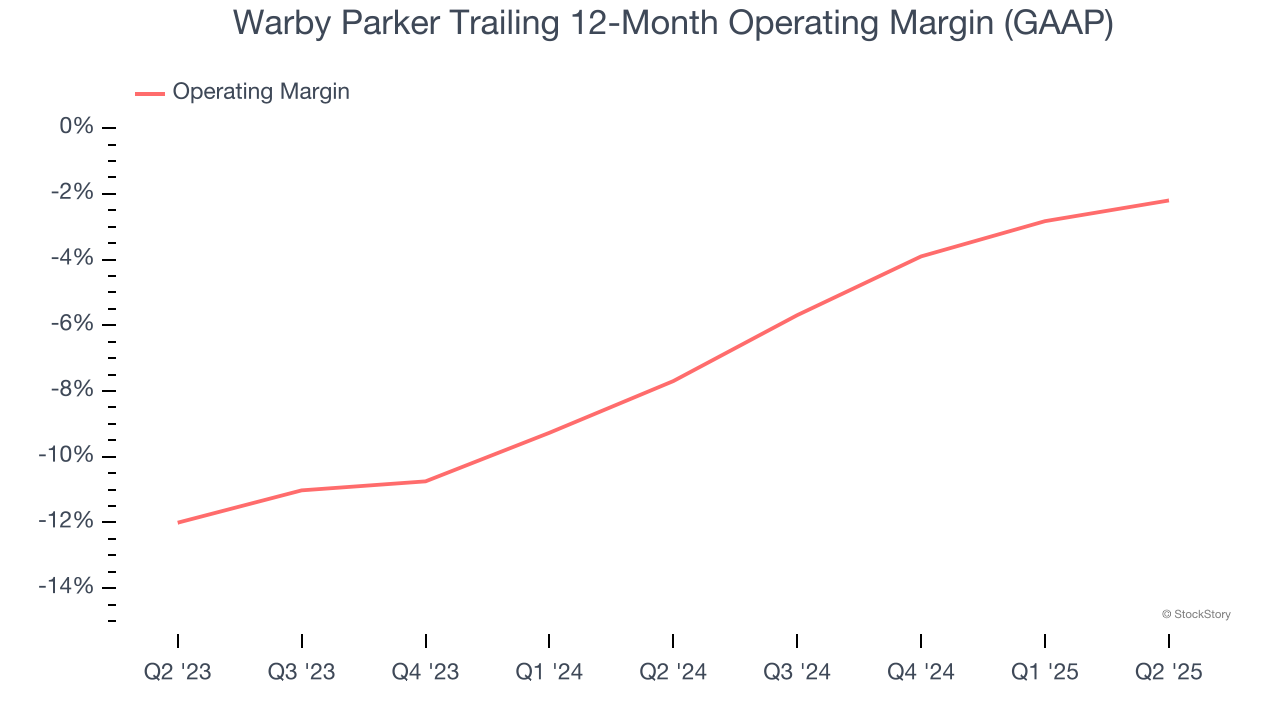
Operating Losses Sound the Alarms
Operating margin is an important measure of profitability as it shows the portion of revenue left after accounting for all core expenses – everything from the cost of goods sold to advertising and wages. It’s also useful for comparing profitability across companies with different levels of debt and tax rates because it excludes interest and taxes.
Despite the consumer retail industry’s secular decline, unprofitable public companies are few and far between. Unfortunately, Warby Parker was one of them over the last two years as its high expenses contributed to an average operating margin of negative 4.8%.
Final Judgment
Warby Parker’s merits more than compensate for its flaws, and with the recent surge, the stock trades at 57.4× forward P/E (or $24.50 per share). Is now a good time to buy? See for yourself in our full research report, it’s free for active Edge members.
Stocks We Like Even More Than Warby Parker
Donald Trump’s April 2025 "Liberation Day" tariffs sent markets into a tailspin, but stocks have since rebounded strongly, proving that knee-jerk reactions often create the best buying opportunities.
The smart money is already positioning for the next leg up. Don’t miss out on the recovery - check out our Top 6 Stocks for this week. This is a curated list of our High Quality stocks that have generated a market-beating return of 183% over the last five years (as of March 31st 2025).
Stocks that made our list in 2020 include now familiar names such as Nvidia (+1,545% between March 2020 and March 2025) as well as under-the-radar businesses like the once-small-cap company Exlservice (+354% five-year return). Find your next big winner with StockStory today.
StockStory is growing and hiring equity analyst and marketing roles. Are you a 0 to 1 builder passionate about the markets and AI? See the open roles here.