Chemed has gotten torched over the last six months - since April 2025, its stock price has dropped 23.7% to $436.07 per share. This was partly driven by its softer quarterly results and might have investors contemplating their next move.
Is there a buying opportunity in Chemed, or does it present a risk to your portfolio? Get the full breakdown from our expert analysts, it’s free for active Edge members.
Why Is Chemed Not Exciting?
Even though the stock has become cheaper, we're cautious about Chemed. Here are three reasons there are better opportunities than CHE and a stock we'd rather own.
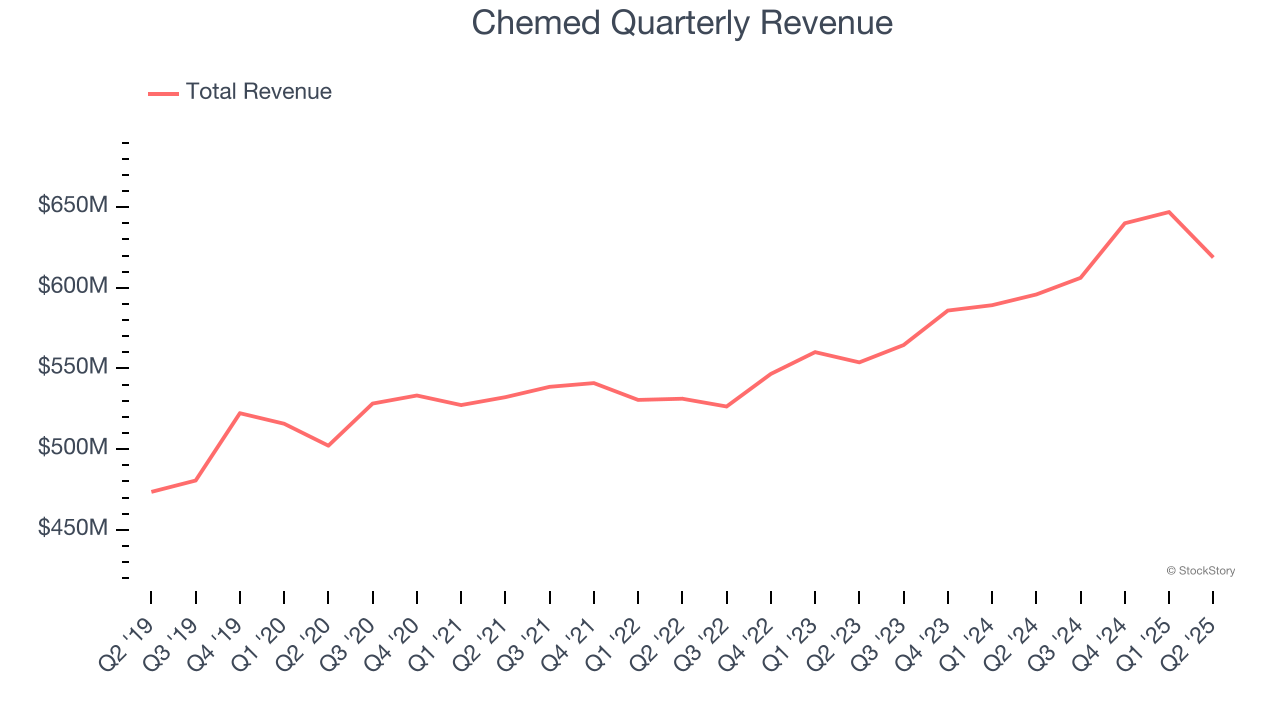
1. Long-Term Revenue Growth Disappoints
A company’s long-term performance is an indicator of its overall quality. Any business can put up a good quarter or two, but many enduring ones grow for years. Unfortunately, Chemed’s 4.4% annualized revenue growth over the last five years was mediocre. This was below our standard for the healthcare sector.
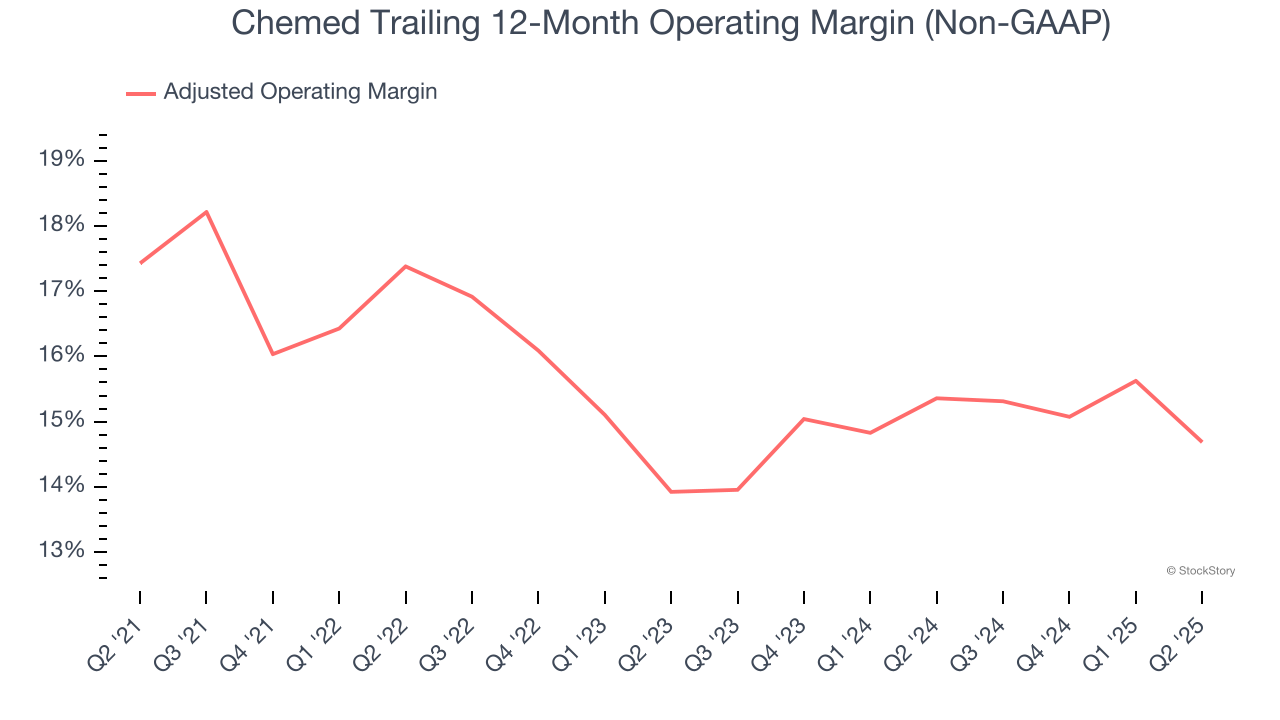
2. Shrinking Adjusted Operating Margin
Adjusted operating margin is a key measure of profitability. Think of it as net income (the bottom line) excluding the impact of non-recurring expenses, taxes, and interest on debt - metrics less connected to business fundamentals.
Looking at the trend in its profitability, Chemed’s adjusted operating margin decreased by 2.7 percentage points over the last five years. This raises questions about the company’s expense base because its revenue growth should have given it leverage on its fixed costs, resulting in better economies of scale and profitability. Its adjusted operating margin for the trailing 12 months was 14.7%.
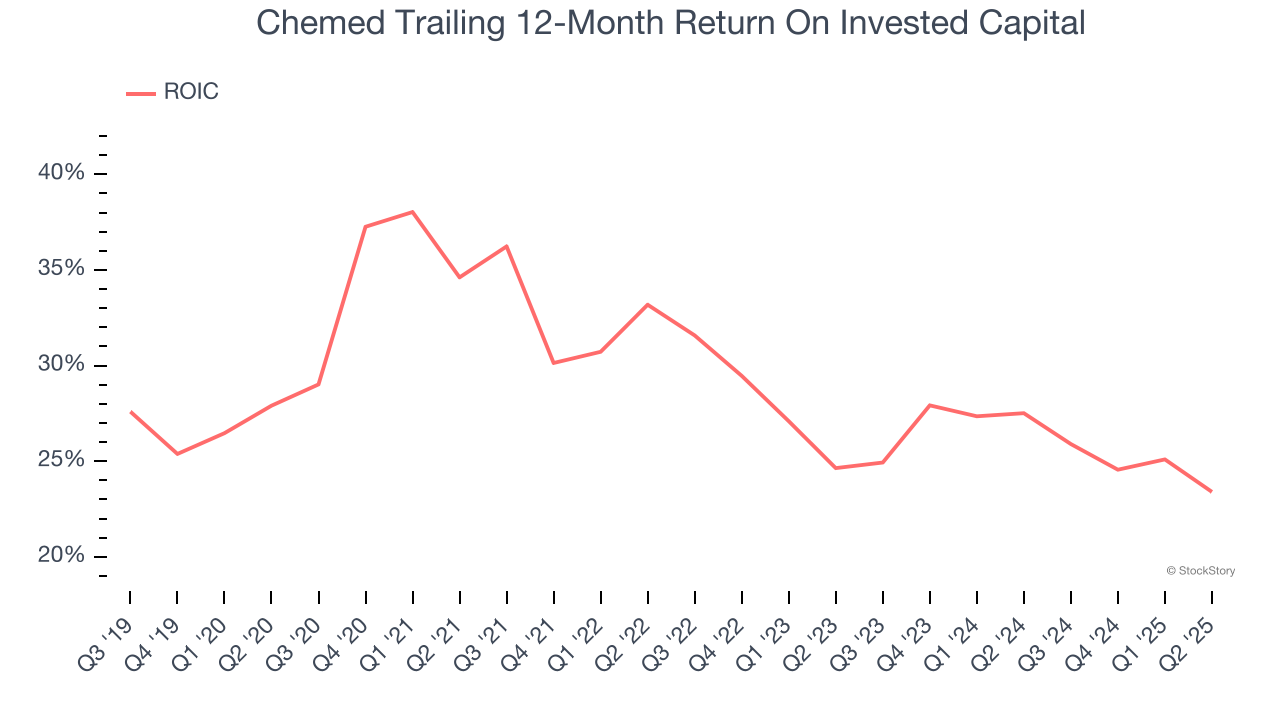
3. New Investments Fail to Bear Fruit as ROIC Declines
A company’s ROIC, or return on invested capital, shows how much operating profit it makes compared to the money it has raised (debt and equity).
We like to invest in businesses with high returns, but the trend in a company’s ROIC is what often surprises the market and moves the stock price. Over the last few years, Chemed’s ROIC has unfortunately decreased. We like what management has done in the past, but its declining returns are perhaps a symptom of fewer profitable growth opportunities.
Final Judgment
Chemed isn’t a terrible business, but it isn’t one of our picks. After the recent drawdown, the stock trades at 18.3× forward P/E (or $436.07 per share). This valuation multiple is fair, but we don’t have much faith in the company. We're pretty confident there are more exciting stocks to buy at the moment. We’d recommend looking at an all-weather company that owns household favorite Taco Bell.
Stocks We Like More Than Chemed
When Trump unveiled his aggressive tariff plan in April 2025, markets tanked as investors feared a full-blown trade war. But those who panicked and sold missed the subsequent rebound that’s already erased most losses.
Don’t let fear keep you from great opportunities and take a look at Top 9 Market-Beating Stocks. This is a curated list of our High Quality stocks that have generated a market-beating return of 183% over the last five years (as of March 31st 2025).
Stocks that made our list in 2020 include now familiar names such as Nvidia (+1,545% between March 2020 and March 2025) as well as under-the-radar businesses like the once-small-cap company Comfort Systems (+782% five-year return). Find your next big winner with StockStory today.
StockStory is growing and hiring equity analyst and marketing roles. Are you a 0 to 1 builder passionate about the markets and AI? See the open roles here.