Since April 2025, Under Armour has been in a holding pattern, posting a small loss of 1.2% while floating around $4.88. The stock also fell short of the S&P 500’s 34.7% gain during that period.
Is there a buying opportunity in Under Armour, or does it present a risk to your portfolio? See what our analysts have to say in our full research report, it’s free for active Edge members.
Why Do We Think Under Armour Will Underperform?
We're cautious about Under Armour. Here are three reasons there are better opportunities than UAA and a stock we'd rather own.
1. Declining Constant Currency Revenue, Demand Takes a Hit
Investors interested in Apparel and Accessories companies should track constant currency revenue in addition to reported revenue. This metric excludes currency movements, which are outside of Under Armour’s control and are not indicative of underlying demand.
Over the last two years, Under Armour’s constant currency revenue averaged 6.7% year-on-year declines. This performance was underwhelming and implies there may be increasing competition or market saturation. It also suggests Under Armour might have to lower prices or invest in product improvements to accelerate growth, factors that can hinder near-term profitability. 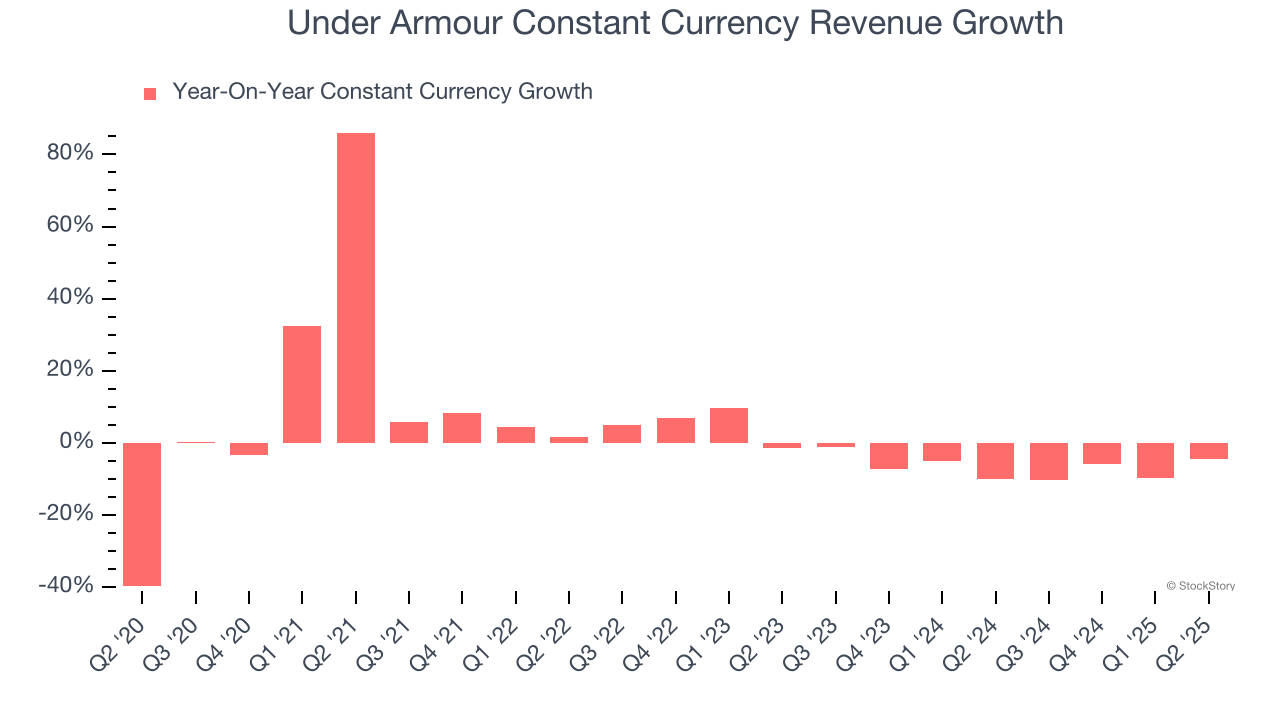
2. Revenue Projections Show Stormy Skies Ahead
Forecasted revenues by Wall Street analysts signal a company’s potential. Predictions may not always be accurate, but accelerating growth typically boosts valuation multiples and stock prices while slowing growth does the opposite.
Over the next 12 months, sell-side analysts expect Under Armour’s revenue to drop by 2.8%. While this projection is better than its two-year trend, it’s hard to get excited about a company that is struggling with demand.
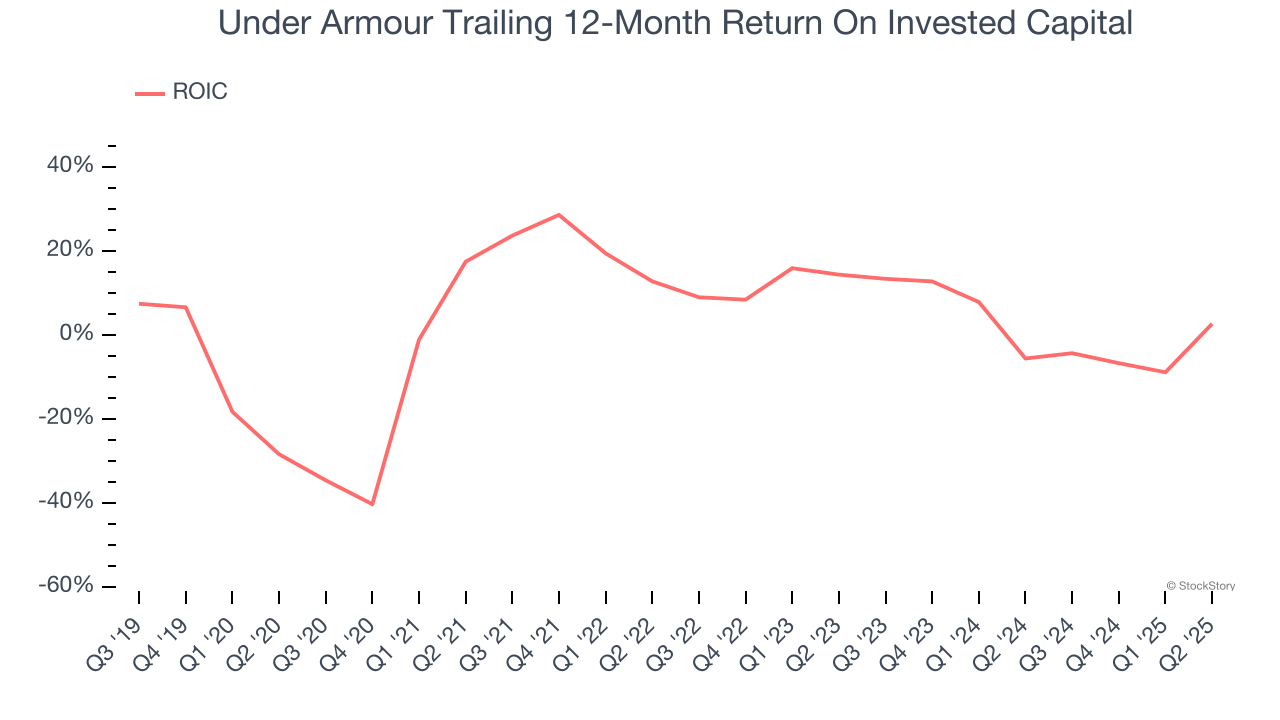
3. New Investments Fail to Bear Fruit as ROIC Declines
A company’s ROIC, or return on invested capital, shows how much operating profit it makes compared to the money it has raised (debt and equity).
We like to invest in businesses with high returns, but the trend in a company’s ROIC is what often surprises the market and moves the stock price. Unfortunately, Under Armour’s ROIC has decreased significantly over the last few years. Paired with its already low returns, these declines suggest its profitable growth opportunities are few and far between.
Final Judgment
We cheer for all companies serving everyday consumers, but in the case of Under Armour, we’ll be cheering from the sidelines. With its shares underperforming the market lately, the stock trades at 83× forward P/E (or $4.88 per share). At this valuation, there’s a lot of good news priced in - we think there are better opportunities elsewhere. Let us point you toward one of Charlie Munger’s all-time favorite businesses.
Stocks We Like More Than Under Armour
When Trump unveiled his aggressive tariff plan in April 2025, markets tanked as investors feared a full-blown trade war. But those who panicked and sold missed the subsequent rebound that’s already erased most losses.
Don’t let fear keep you from great opportunities and take a look at Top 9 Market-Beating Stocks. This is a curated list of our High Quality stocks that have generated a market-beating return of 183% over the last five years (as of March 31st 2025).
Stocks that made our list in 2020 include now familiar names such as Nvidia (+1,545% between March 2020 and March 2025) as well as under-the-radar businesses like the once-small-cap company Comfort Systems (+782% five-year return). Find your next big winner with StockStory today.
StockStory is growing and hiring equity analyst and marketing roles. Are you a 0 to 1 builder passionate about the markets and AI? See the open roles here.