
While the S&P 500 is up 34.7% since April 2025, S&P Global (currently trading at $481.88 per share) has lagged behind, posting a return of 9.1%. This may have investors wondering how to approach the situation.
Taking into account the weaker price action, is now a good time to buy SPGI, or is it a pass? Find out in our full research report, it’s free for active Edge members.
Why Is SPGI a Good Business?
Tracing its roots back to 1860 when it published the first railroad industry manual, S&P Global (NYSE: SPGI) provides credit ratings, market intelligence, commodity data, automotive analytics, and financial indices that help investors and businesses make decisions.
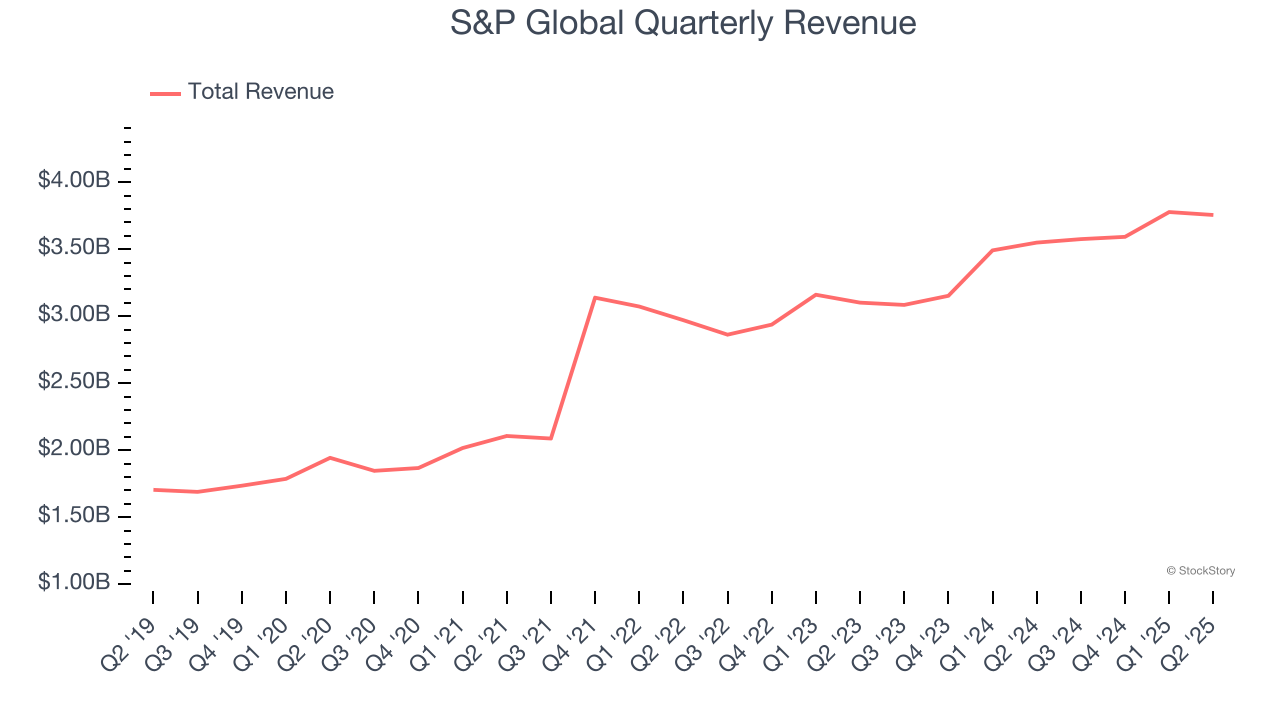
1. Skyrocketing Revenue Shows Strong Momentum
A company’s long-term sales performance is one signal of its overall quality. Any business can put up a good quarter or two, but the best consistently grow over the long haul.
Over the last five years, S&P Global grew its revenue at an impressive 15.5% compounded annual growth rate. Its growth surpassed the average financials company and shows its offerings resonate with customers.
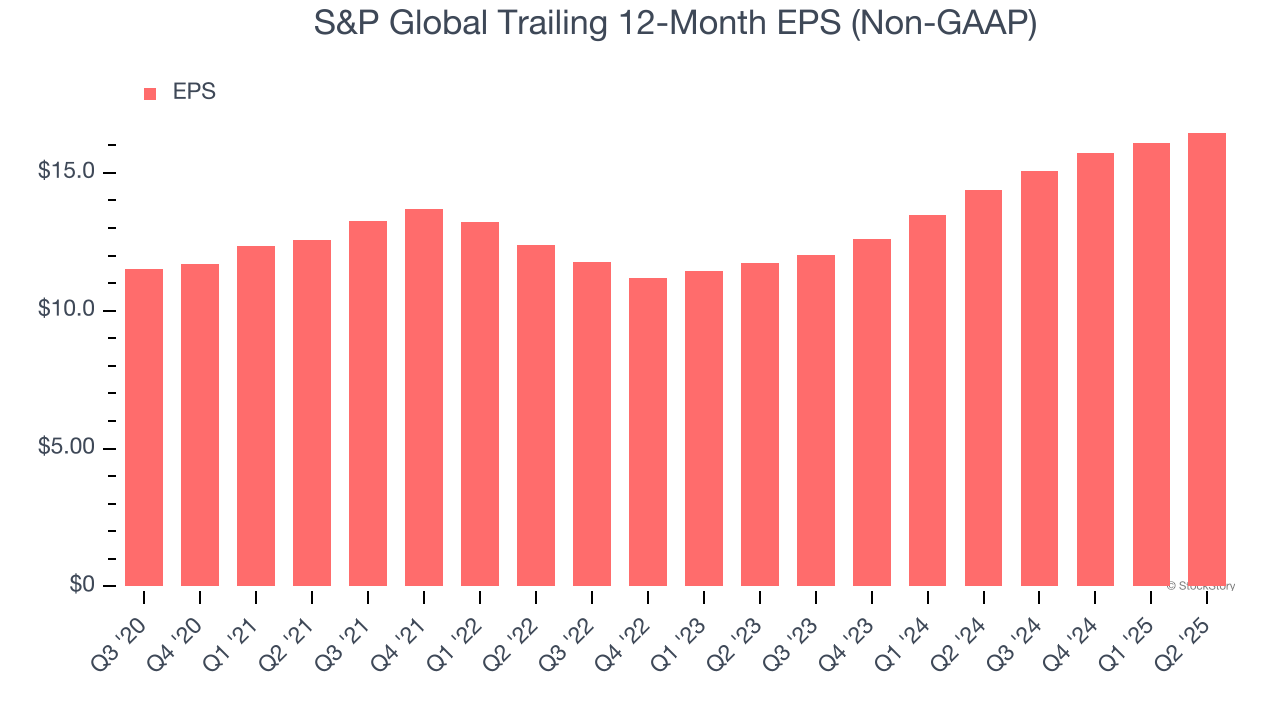
2. EPS Surges Higher Over the Last Two Years
While long-term earnings trends give us the big picture, we also track EPS over a shorter period because it can provide insight into an emerging theme or development for the business.
S&P Global’s EPS grew at a remarkable 18.4% compounded annual growth rate over the last two years, higher than its 10.4% annualized revenue growth. This tells us the company became more profitable on a per-share basis as it expanded.
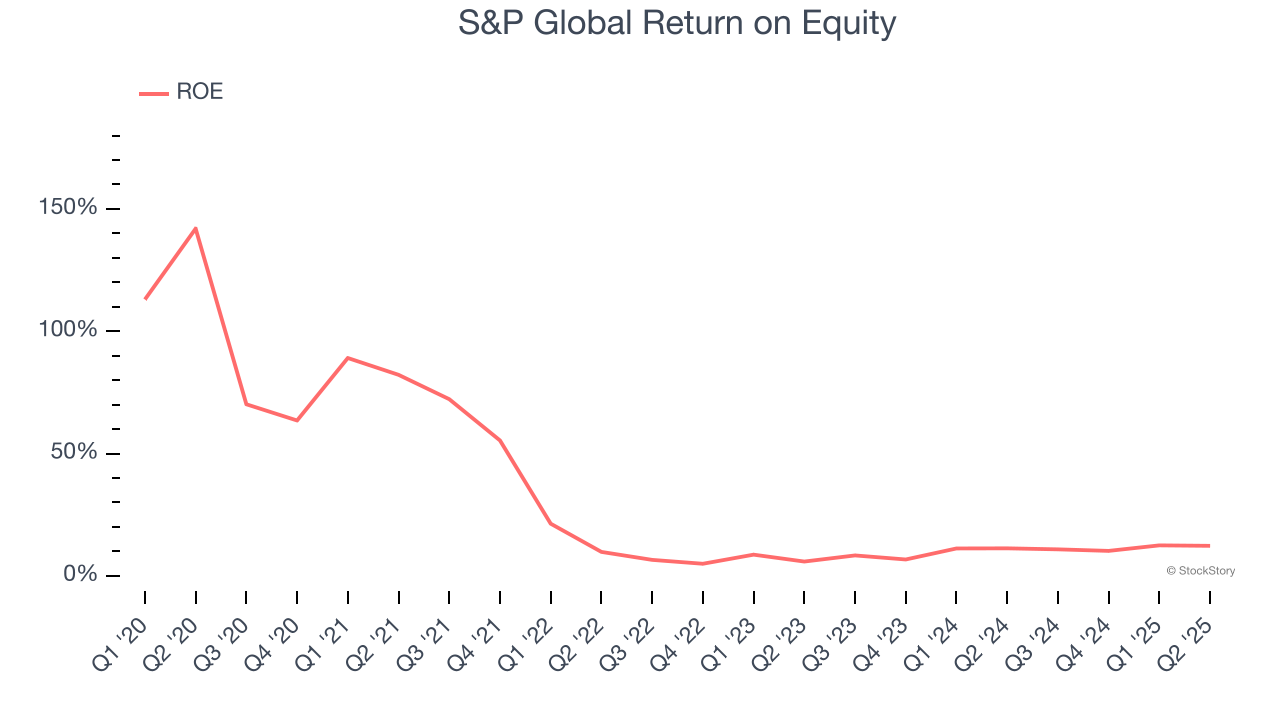
3. Stellar ROE Showcases Lucrative Growth Opportunities
Return on equity, or ROE, quantifies bank profitability relative to shareholder equity - an essential capital source for these institutions. Over extended periods, superior ROE performance drives faster shareholder wealth compounding through reinvestment, share repurchases, and dividend growth.
Over the last five years, S&P Global has averaged an ROE of 28.6%, exceptional for a company operating in a sector where the average shakes out around 10% and those putting up 25%+ are greatly admired. This shows S&P Global has a strong competitive moat.
Final Judgment
These are just a few reasons why S&P Global ranks highly on our list. With its shares trailing the market in recent months, the stock trades at 26.4× forward P/E (or $481.88 per share). Is now a good time to buy? See for yourself in our in-depth research report, it’s free for active Edge members.
Stocks We Like Even More Than S&P Global
Donald Trump’s April 2025 "Liberation Day" tariffs sent markets into a tailspin, but stocks have since rebounded strongly, proving that knee-jerk reactions often create the best buying opportunities.
The smart money is already positioning for the next leg up. Don’t miss out on the recovery - check out our Top 5 Growth Stocks for this month. This is a curated list of our High Quality stocks that have generated a market-beating return of 183% over the last five years (as of March 31st 2025).
Stocks that made our list in 2020 include now familiar names such as Nvidia (+1,545% between March 2020 and March 2025) as well as under-the-radar businesses like the once-micro-cap company Kadant (+351% five-year return). Find your next big winner with StockStory today.
StockStory is growing and hiring equity analyst and marketing roles. Are you a 0 to 1 builder passionate about the markets and AI? See the open roles here.