Hayward trades at $15.45 per share and has stayed right on track with the overall market, gaining 36.5% over the last six months. At the same time, the S&P 500 has returned 34.7%.
Is now the time to buy Hayward, or should you be careful about including it in your portfolio? Get the full stock story straight from our expert analysts, it’s free for active Edge members.
Why Is Hayward Not Exciting?
We don't have much confidence in Hayward. Here are three reasons we avoid HAYW and a stock we'd rather own.
1. Slow Organic Growth Suggests Waning Demand In Core Business
Investors interested in Home Construction Materials companies should track organic revenue in addition to reported revenue. This metric gives visibility into Hayward’s core business because it excludes one-time events such as mergers, acquisitions, and divestitures along with foreign currency fluctuations - non-fundamental factors that can manipulate the income statement.
Over the last two years, Hayward’s organic revenue averaged 3% year-on-year growth. This performance was underwhelming and suggests it may need to improve its products, pricing, or go-to-market strategy, which can add an extra layer of complexity to its operations. 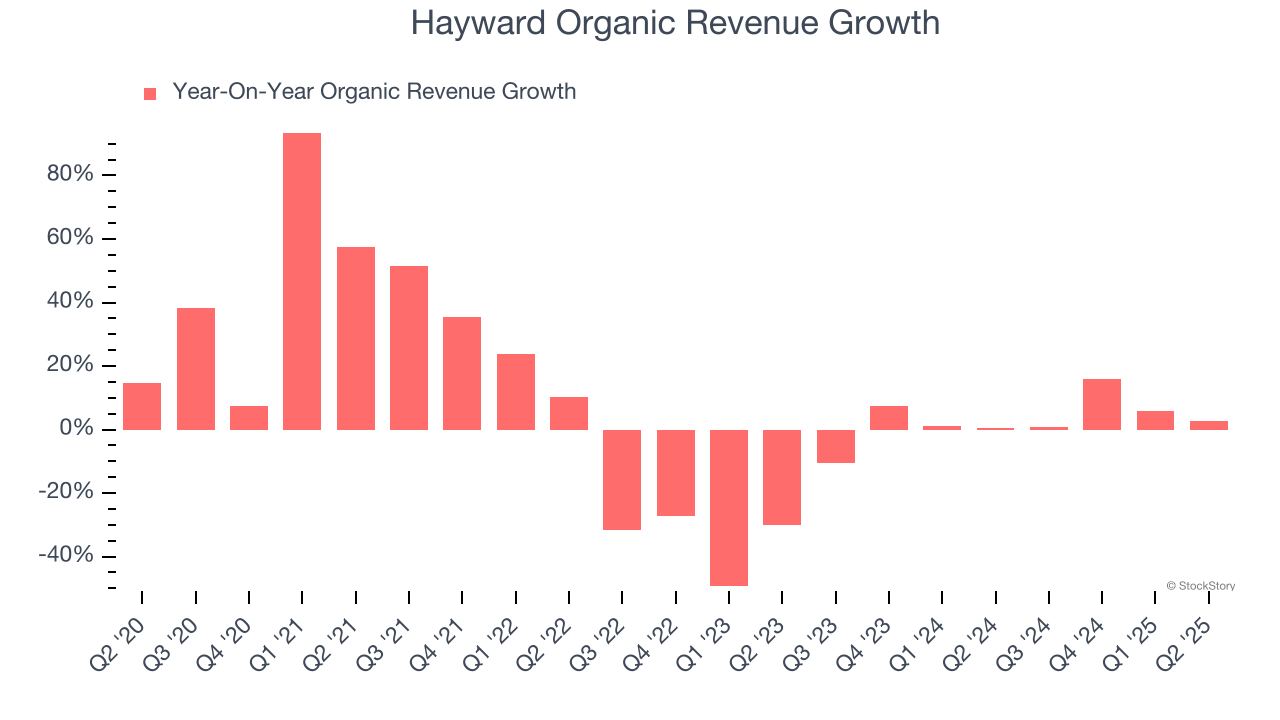
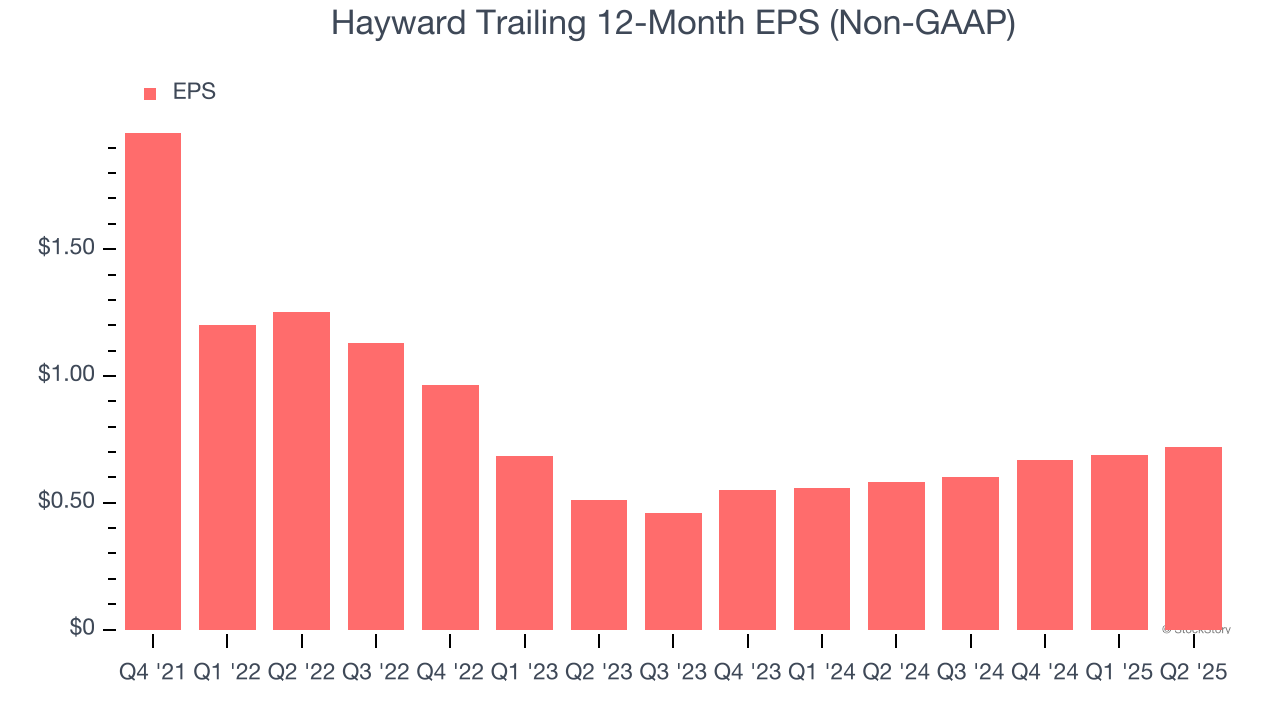
2. EPS Trending Down
Analyzing the long-term change in earnings per share (EPS) shows whether a company's incremental sales were profitable – for example, revenue could be inflated through excessive spending on advertising and promotions.
Hayward’s full-year EPS dropped 186%, or 30% annually, over the last four years. We tend to steer our readers away from companies with falling revenue and EPS, where diminishing earnings could imply changing secular trends and preferences. If the tide turns unexpectedly, Hayward’s low margin of safety could leave its stock price susceptible to large downswings.
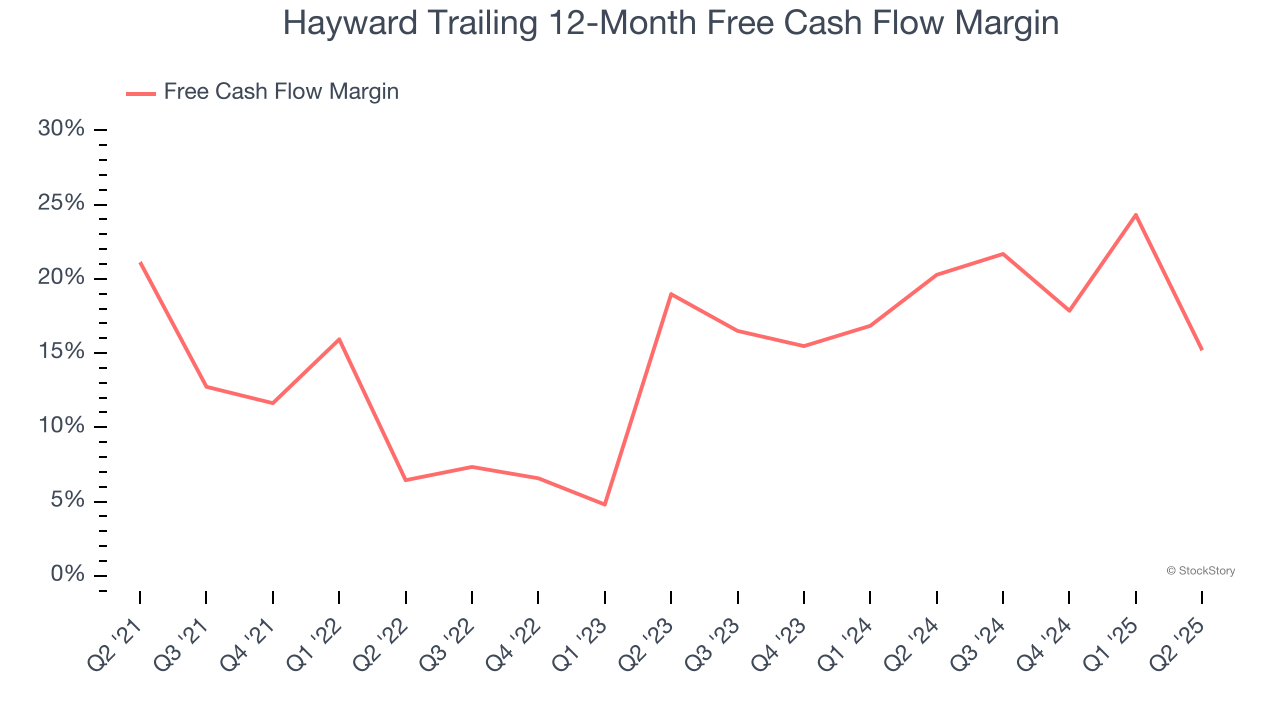
3. Free Cash Flow Margin Dropping
Free cash flow isn't a prominently featured metric in company financials and earnings releases, but we think it's telling because it accounts for all operating and capital expenses, making it tough to manipulate. Cash is king.
As you can see below, Hayward’s margin dropped by 5.9 percentage points over the last five years. If its declines continue, it could signal increasing investment needs and capital intensity. Hayward’s free cash flow margin for the trailing 12 months was 15.2%.
Final Judgment
Hayward isn’t a terrible business, but it doesn’t pass our bar. That said, the stock currently trades at 20.1× forward P/E (or $15.45 per share). This valuation multiple is fair, but we don’t have much faith in the company. We're fairly confident there are better investments elsewhere. We’d recommend looking at a safe-and-steady industrials business benefiting from an upgrade cycle.
Stocks We Like More Than Hayward
Trump’s April 2025 tariff bombshell triggered a massive market selloff, but stocks have since staged an impressive recovery, leaving those who panic sold on the sidelines.
Take advantage of the rebound by checking out our Top 9 Market-Beating Stocks. This is a curated list of our High Quality stocks that have generated a market-beating return of 183% over the last five years (as of March 31st 2025).
Stocks that made our list in 2020 include now familiar names such as Nvidia (+1,545% between March 2020 and March 2025) as well as under-the-radar businesses like the once-small-cap company Exlservice (+354% five-year return). Find your next big winner with StockStory today.
StockStory is growing and hiring equity analyst and marketing roles. Are you a 0 to 1 builder passionate about the markets and AI? See the open roles here.