What a time it’s been for TD SYNNEX. In the past six months alone, the company’s stock price has increased by a massive 51%, reaching $160.95 per share. This was partly due to its solid quarterly results, and the performance may have investors wondering how to approach the situation.
Is there a buying opportunity in TD SYNNEX, or does it present a risk to your portfolio? Check out our in-depth research report to see what our analysts have to say, it’s free for active Edge members.
Why Is TD SYNNEX Not Exciting?
We’re glad investors have benefited from the price increase, but we don't have much confidence in TD SYNNEX. Here are three reasons we avoid SNX and a stock we'd rather own.
1. Lackluster Revenue Growth
We at StockStory place the most emphasis on long-term growth, but within business services, a stretched historical view may miss recent innovations or disruptive industry trends. TD SYNNEX’s recent performance shows its demand has slowed significantly as its annualized revenue growth of 1.3% over the last two years was well below its five-year trend. 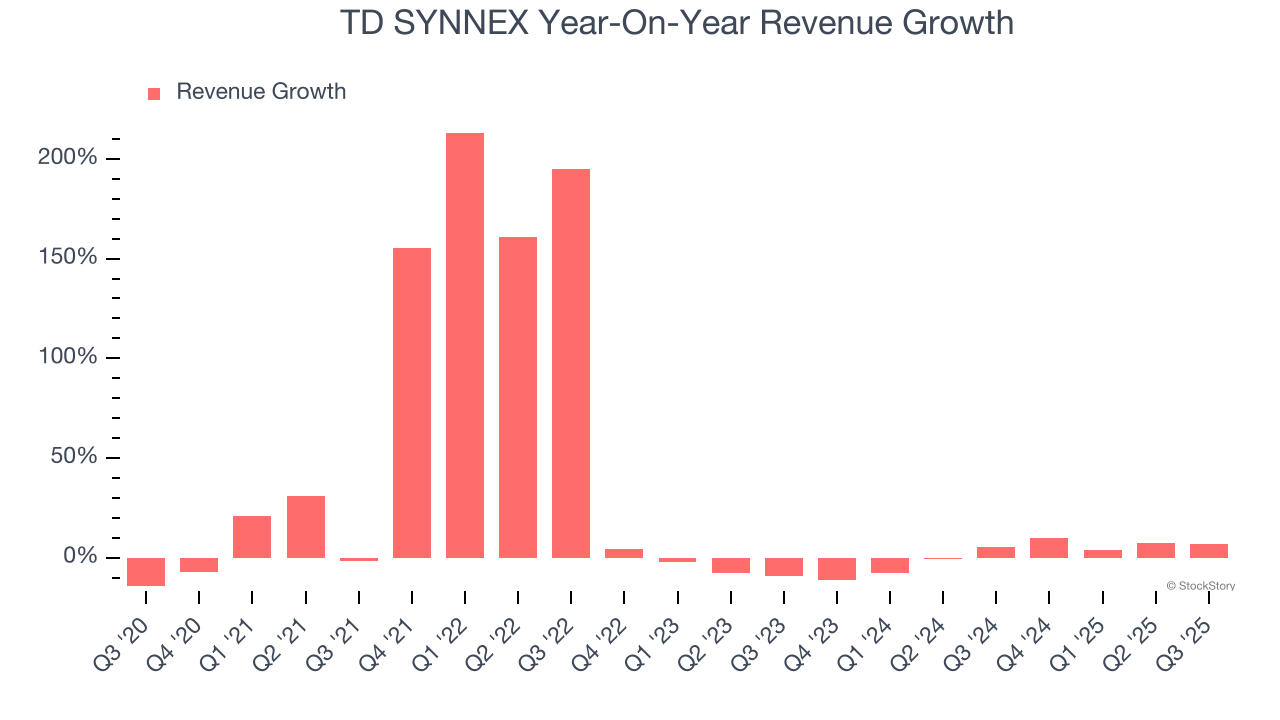
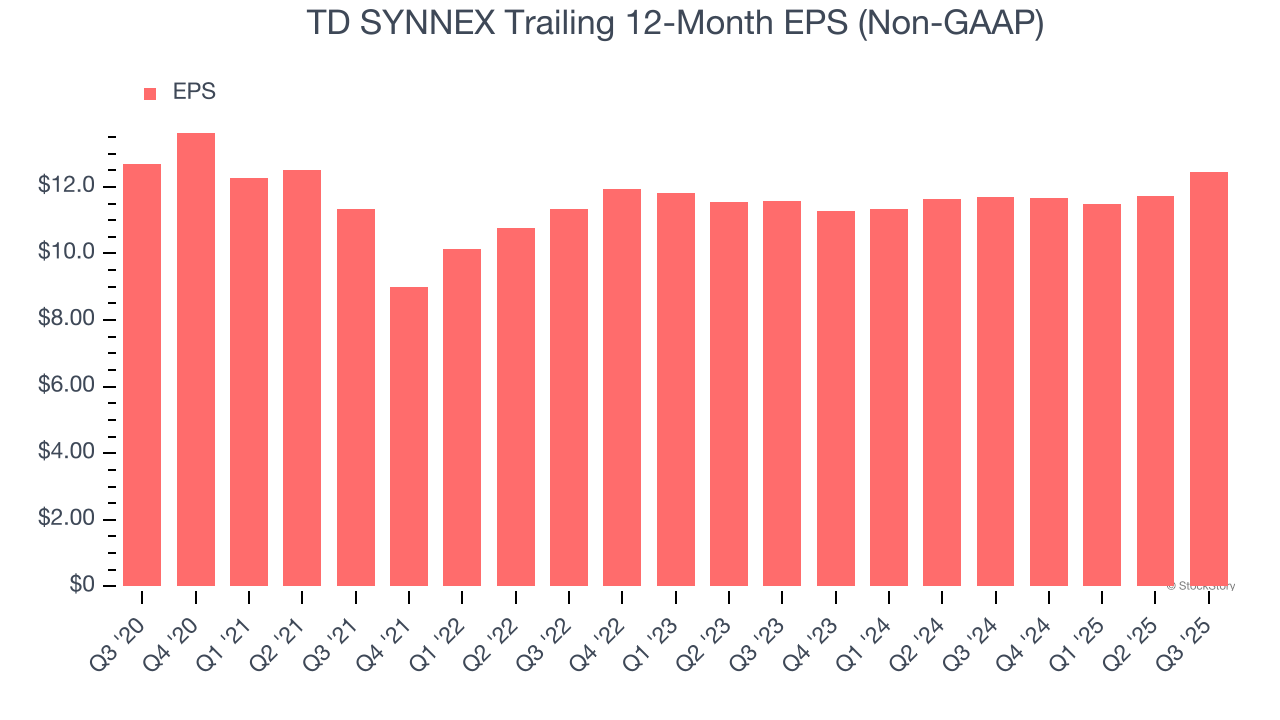
2. EPS Growth Has Stalled
We track the long-term change in earnings per share (EPS) because it highlights whether a company’s growth is profitable.
TD SYNNEX’s flat EPS over the last five years was below its 24.4% annualized revenue growth. This tells us the company became less profitable on a per-share basis as it expanded.
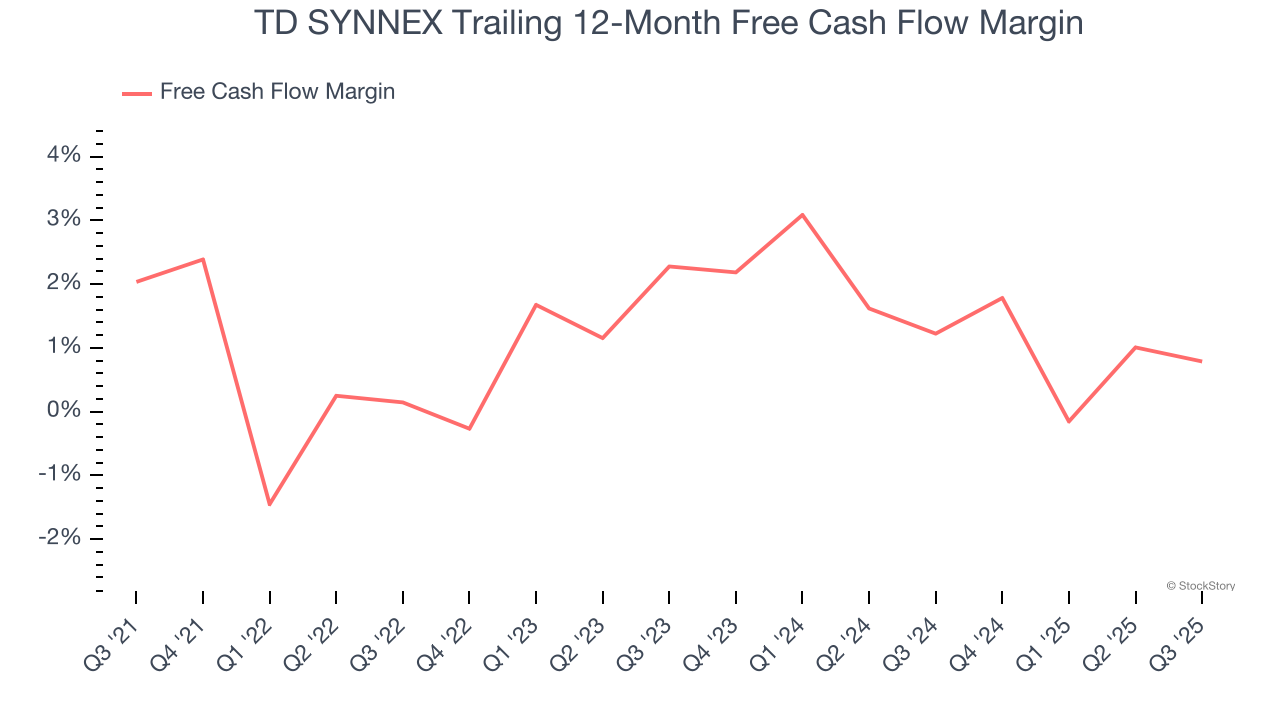
3. Mediocre Free Cash Flow Margin Limits Reinvestment Potential
Free cash flow isn't a prominently featured metric in company financials and earnings releases, but we think it's telling because it accounts for all operating and capital expenses, making it tough to manipulate. Cash is king.
TD SYNNEX has shown poor cash profitability over the last five years, giving the company limited opportunities to return capital to shareholders. Its free cash flow margin averaged 1.2%, lousy for a business services business.
Final Judgment
TD SYNNEX isn’t a terrible business, but it doesn’t pass our quality test. After the recent surge, the stock trades at 11.4× forward P/E (or $160.95 per share). This valuation multiple is fair, but we don’t have much faith in the company. We're pretty confident there are superior stocks to buy right now. We’d suggest looking at our favorite semiconductor picks and shovels play.
High-Quality Stocks for All Market Conditions
Donald Trump’s April 2025 "Liberation Day" tariffs sent markets into a tailspin, but stocks have since rebounded strongly, proving that knee-jerk reactions often create the best buying opportunities.
The smart money is already positioning for the next leg up. Don’t miss out on the recovery - check out our Top 5 Strong Momentum Stocks for this week. This is a curated list of our High Quality stocks that have generated a market-beating return of 183% over the last five years (as of March 31st 2025).
Stocks that made our list in 2020 include now familiar names such as Nvidia (+1,545% between March 2020 and March 2025) as well as under-the-radar businesses like the once-small-cap company Comfort Systems (+782% five-year return). Find your next big winner with StockStory today.
StockStory is growing and hiring equity analyst and marketing roles. Are you a 0 to 1 builder passionate about the markets and AI? See the open roles here.