
What a fantastic six months it’s been for Shoals. Shares of the company have skyrocketed 142%, hitting $8.85. This was partly due to its solid quarterly results, and the performance may have investors wondering how to approach the situation.
Is now the time to buy Shoals, or should you be careful about including it in your portfolio? Dive into our full research report to see our analyst team’s opinion, it’s free for active Edge members.
Why Do We Think Shoals Will Underperform?
We’re happy investors have made money, but we're cautious about Shoals. Here are three reasons there are better opportunities than SHLS and a stock we'd rather own.
1. Weak Backlog Growth Points to Soft Demand
We can better understand Renewable Energy companies by analyzing their backlog. This metric shows the value of outstanding orders that have not yet been executed or delivered, giving visibility into Shoals’s future revenue streams.
Shoals’s backlog came in at $671.3 million in the latest quarter, and over the last two years, its year-on-year growth averaged 3.3%. This performance was underwhelming and suggests that increasing competition is causing challenges in winning new orders. 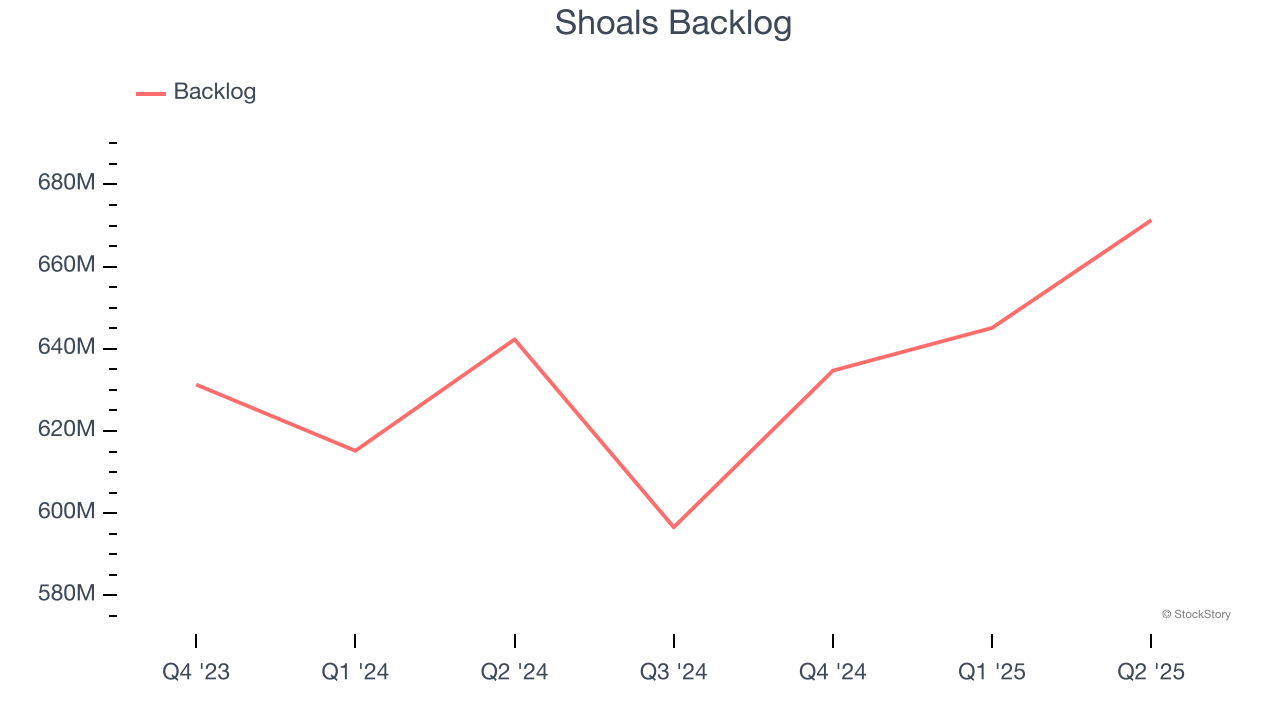
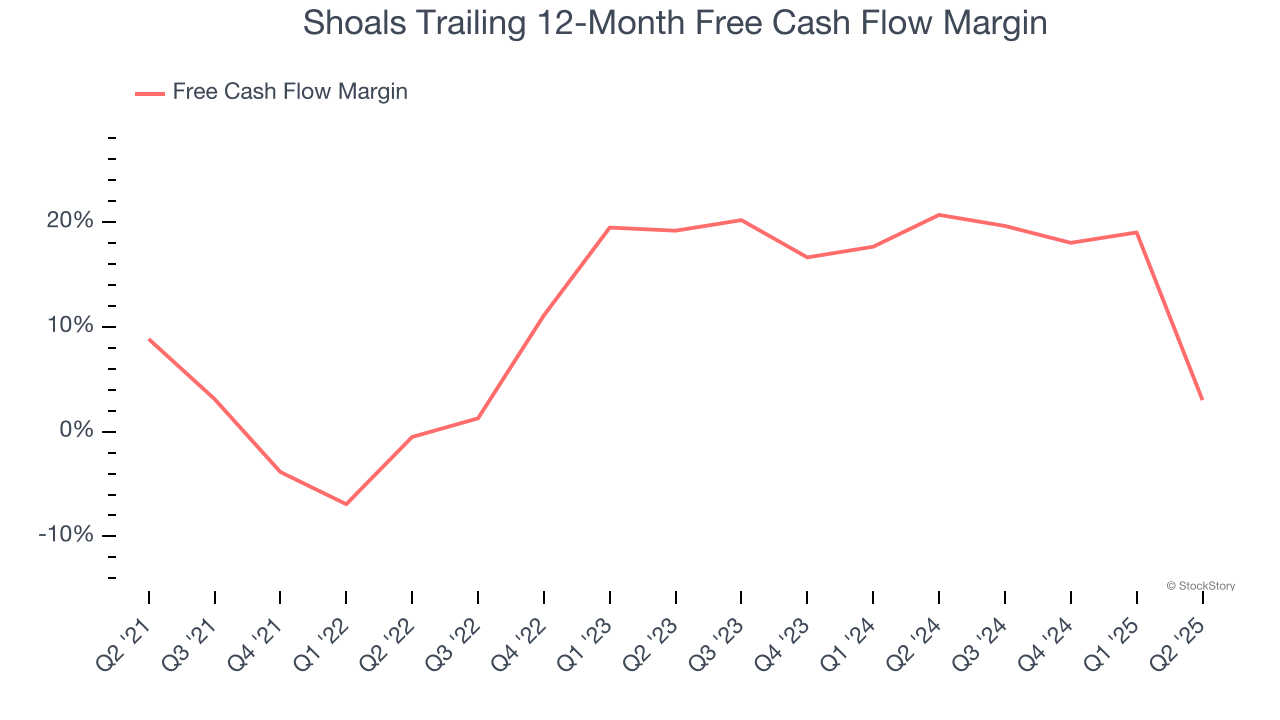
2. Free Cash Flow Margin Dropping
If you’ve followed StockStory for a while, you know we emphasize free cash flow. Why, you ask? We believe that in the end, cash is king, and you can’t use accounting profits to pay the bills.
As you can see below, Shoals’s margin dropped by 5.8 percentage points over the last five years. Continued declines could signal it is in the middle of an investment cycle. Shoals’s free cash flow margin for the trailing 12 months was 3%.
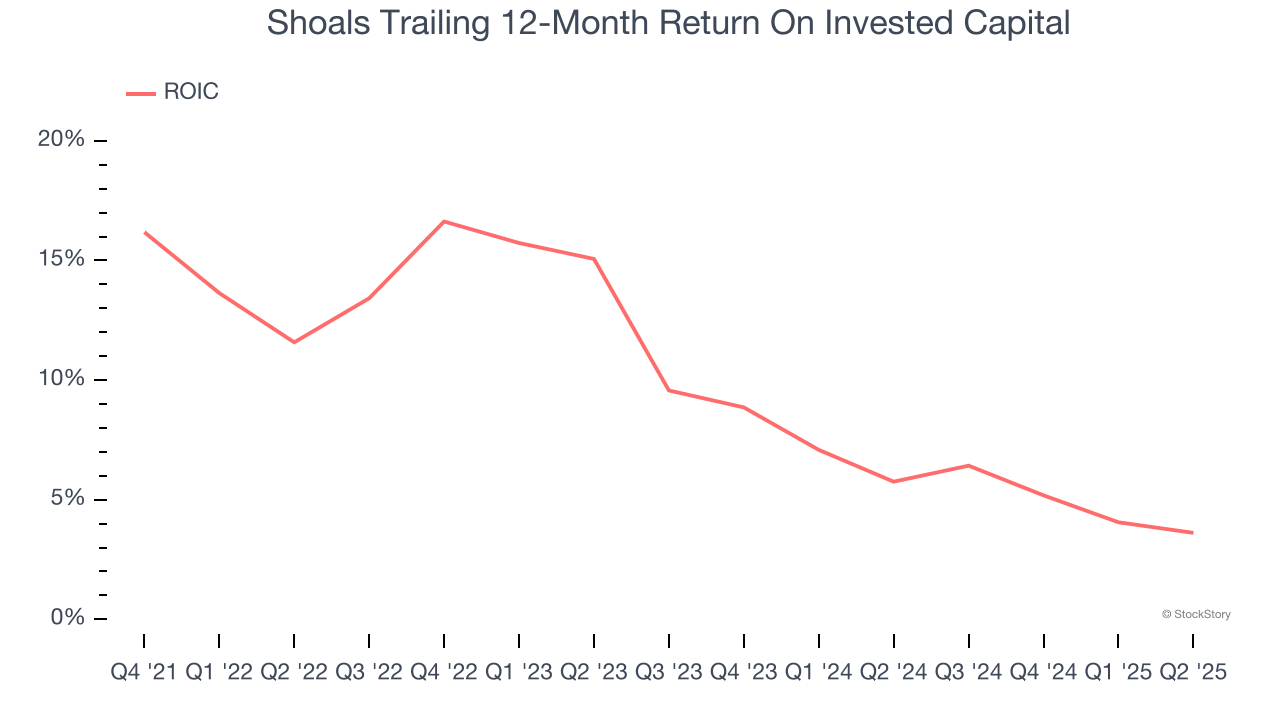
3. New Investments Fail to Bear Fruit as ROIC Declines
ROIC, or return on invested capital, is a metric showing how much operating profit a company generates relative to the money it has raised (debt and equity).
We like to invest in businesses with high returns, but the trend in a company’s ROIC is what often surprises the market and moves the stock price. Over the last few years, Shoals’s ROIC has unfortunately decreased. Paired with its already low returns, these declines suggest its profitable growth opportunities are few and far between.
Final Judgment
Shoals falls short of our quality standards. After the recent surge, the stock trades at 18.8× forward P/E (or $8.85 per share). At this valuation, there’s a lot of good news priced in - we think other companies feature superior fundamentals at the moment. We’d recommend looking at the most dominant software business in the world.
Stocks We Like More Than Shoals
Trump’s April 2025 tariff bombshell triggered a massive market selloff, but stocks have since staged an impressive recovery, leaving those who panic sold on the sidelines.
Take advantage of the rebound by checking out our Top 5 Strong Momentum Stocks for this week. This is a curated list of our High Quality stocks that have generated a market-beating return of 183% over the last five years (as of March 31st 2025).
Stocks that made our list in 2020 include now familiar names such as Nvidia (+1,545% between March 2020 and March 2025) as well as under-the-radar businesses like the once-small-cap company Exlservice (+354% five-year return). Find your next big winner with StockStory today.
StockStory is growing and hiring equity analyst and marketing roles. Are you a 0 to 1 builder passionate about the markets and AI? See the open roles here.


