
CBIZ’s stock price has taken a beating over the past six months, shedding 28.3% of its value and falling to $53.10 per share. This may have investors wondering how to approach the situation.
Given the weaker price action, is this a buying opportunity for CBZ? Find out in our full research report, it’s free for active Edge members.
Why Does CBZ Stock Spark Debate?
With over 120 offices across 33 states and a team of more than 6,700 professionals, CBIZ (NYSE: CBZ) provides accounting, tax, benefits, insurance brokerage, and advisory services to help small and mid-sized businesses manage their finances and operations.
Two Things to Like:
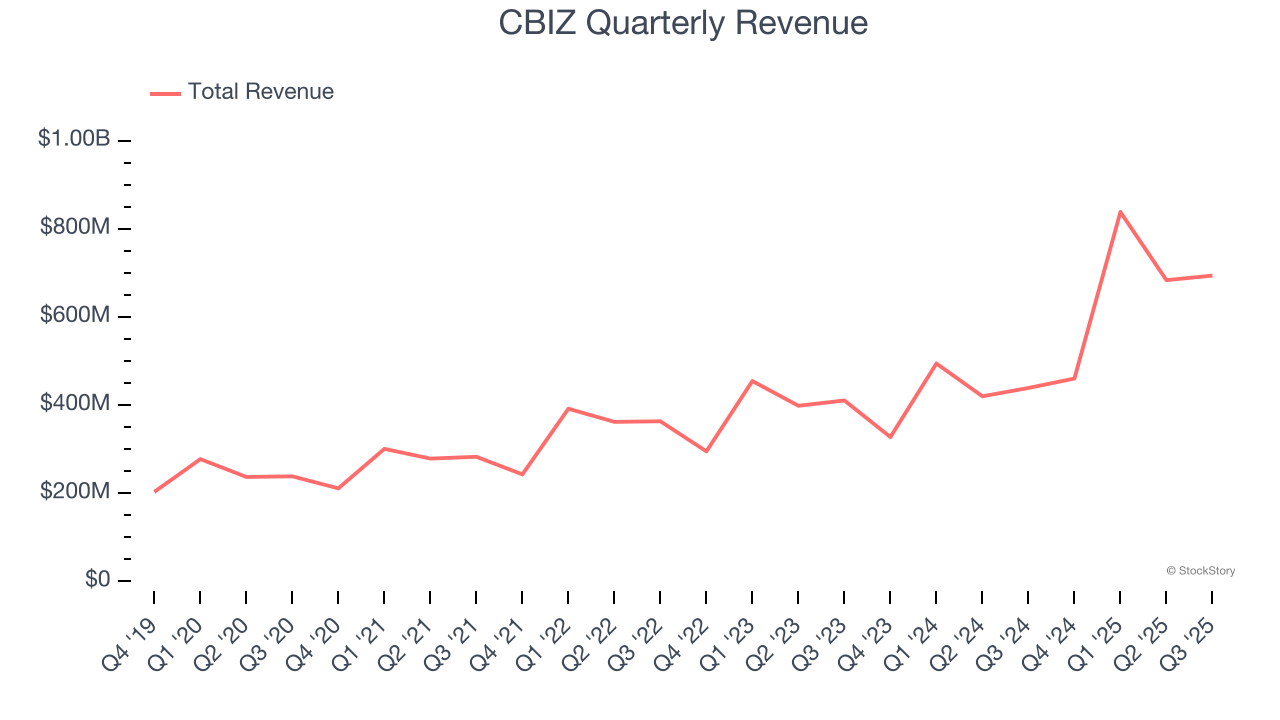
1. Skyrocketing Revenue Shows Strong Momentum
A company’s long-term performance is an indicator of its overall quality. Any business can put up a good quarter or two, but the best consistently grow over the long haul. Over the last five years, CBIZ grew its sales at an incredible 22.9% compounded annual growth rate. Its growth beat the average business services company and shows its offerings resonate with customers.
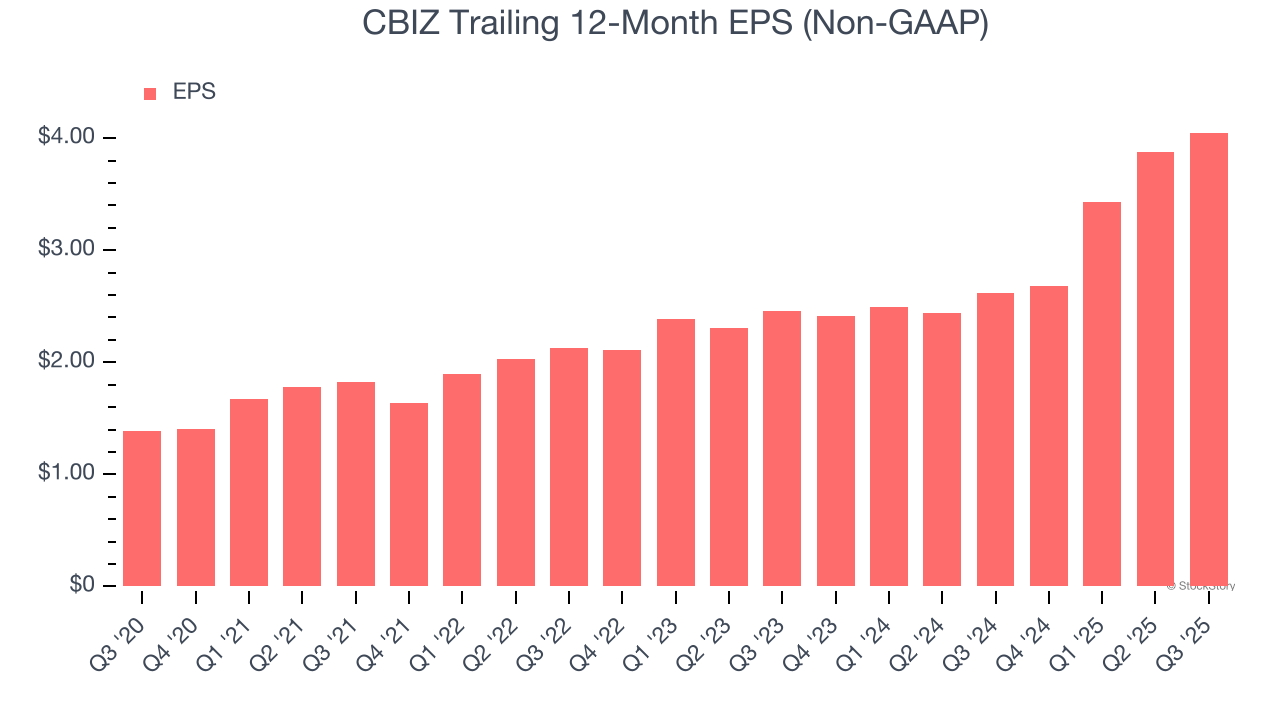
2. Outstanding Long-Term EPS Growth
We track the long-term change in earnings per share (EPS) because it highlights whether a company’s growth is profitable.
CBIZ’s astounding 23.8% annual EPS growth over the last five years aligns with its revenue performance. This tells us its incremental sales were profitable.
One Reason to be Careful:
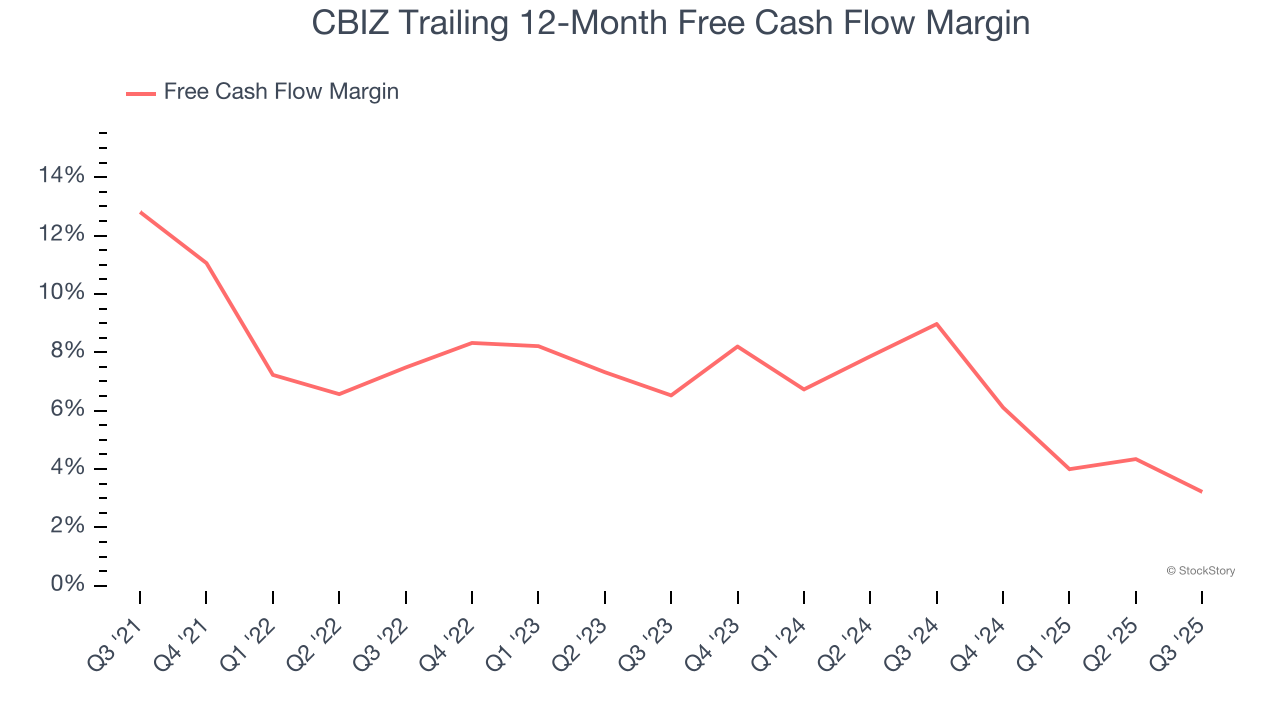
Free Cash Flow Margin Dropping
If you’ve followed StockStory for a while, you know we emphasize free cash flow. Why, you ask? We believe that in the end, cash is king, and you can’t use accounting profits to pay the bills.
As you can see below, CBIZ’s margin dropped by 9.6 percentage points over the last five years. If its declines continue, it could signal increasing investment needs and capital intensity. CBIZ’s free cash flow margin for the trailing 12 months was 3.2%.
Final Judgment
CBIZ’s merits more than compensate for its flaws. After the recent drawdown, the stock trades at 13.6× forward P/E (or $53.10 per share). Is now the right time to buy? See for yourself in our full research report, it’s free for active Edge members.
High-Quality Stocks for All Market Conditions
Trump’s April 2025 tariff bombshell triggered a massive market selloff, but stocks have since staged an impressive recovery, leaving those who panic sold on the sidelines.
Take advantage of the rebound by checking out our Top 5 Growth Stocks for this month. This is a curated list of our High Quality stocks that have generated a market-beating return of 183% over the last five years (as of March 31st 2025).
Stocks that made our list in 2020 include now familiar names such as Nvidia (+1,545% between March 2020 and March 2025) as well as under-the-radar businesses like the once-micro-cap company Kadant (+351% five-year return). Find your next big winner with StockStory today.
StockStory is growing and hiring equity analyst and marketing roles. Are you a 0 to 1 builder passionate about the markets and AI? See the open roles here.


