
Since November 2020, the S&P 500 has delivered a total return of 89.9%. But one standout stock has nearly doubled the market - over the past five years, AECOM has surged 171% to $130.81 per share. Its momentum hasn’t stopped as it’s also gained 23% in the last six months, beating the S&P by 7.7%.
Is now the time to buy AECOM, or should you be careful about including it in your portfolio? Get the full stock story straight from our expert analysts, it’s free for active Edge members.
Why Is AECOM Not Exciting?
Despite the momentum, we're swiping left on AECOM for now. Here are three reasons there are better opportunities than ACM and a stock we'd rather own.
1. Backlog Declines as Orders Drop
Investors interested in Engineering and Design Services companies should track backlog in addition to reported revenue. This metric shows the value of outstanding orders that have not yet been executed or delivered, giving visibility into AECOM’s future revenue streams.
AECOM’s backlog came in at $24.59 billion in the latest quarter, and it averaged 2% year-on-year declines over the last two years. This performance was underwhelming and shows the company is not winning new orders. It also suggests there may be increasing competition or market saturation. 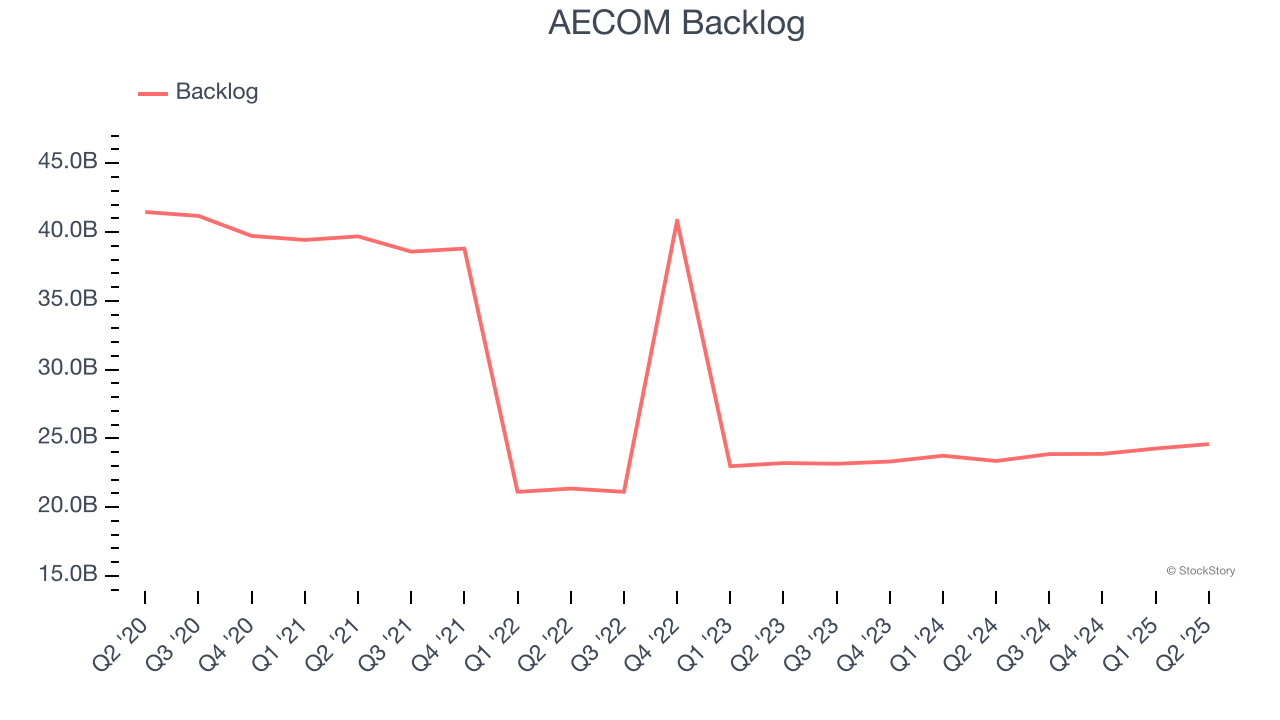
2. Low Gross Margin Reveals Weak Structural Profitability
All else equal, we prefer higher gross margins because they usually indicate that a company sells more differentiated products and commands stronger pricing power.
AECOM has bad unit economics for an industrials business, signaling it operates in a competitive market. As you can see below, it averaged a 6.6% gross margin over the last five years. Said differently, AECOM had to pay a chunky $93.45 to its suppliers for every $100 in revenue. 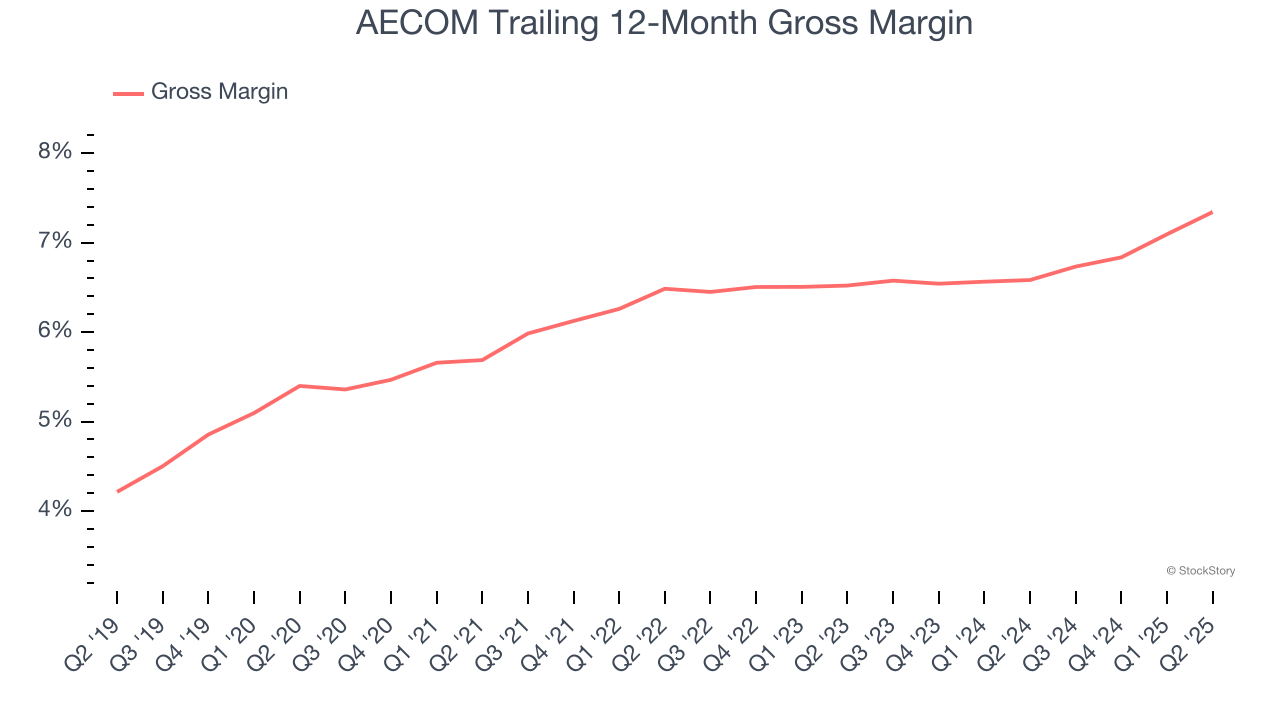
3. Weak Operating Margin Could Cause Trouble
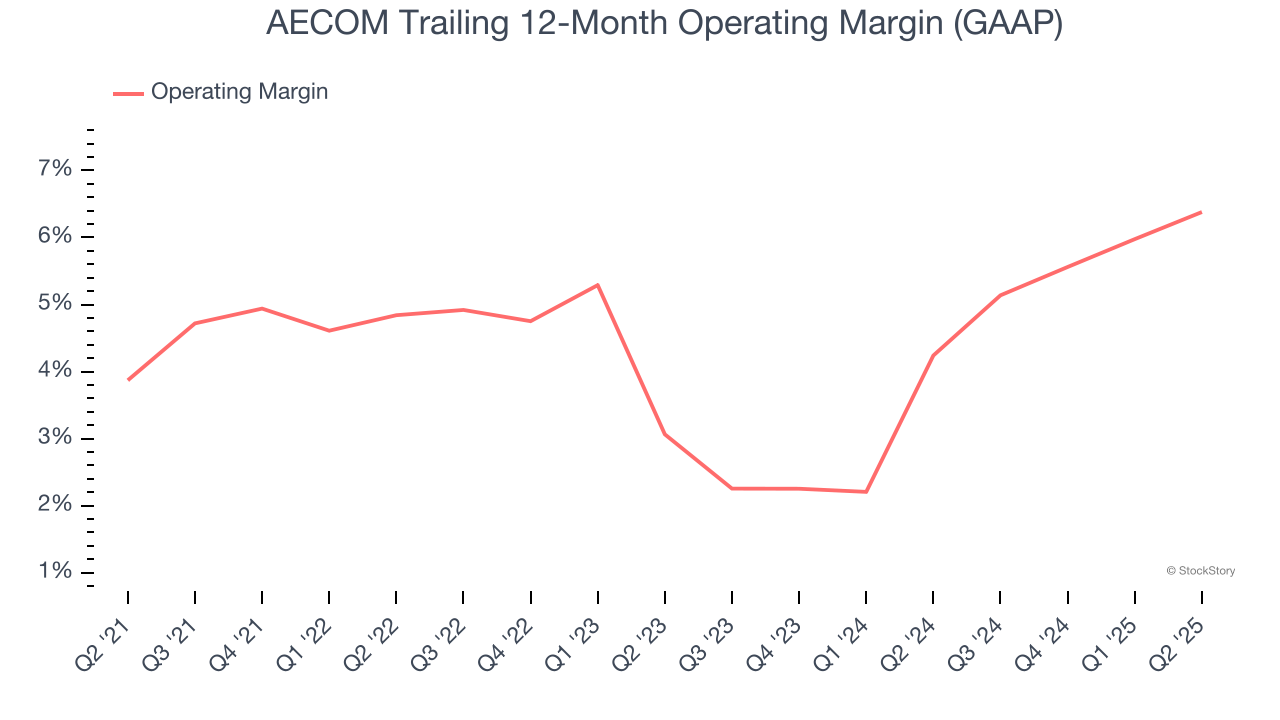
Operating margin is a key measure of profitability. Think of it as net income - the bottom line - excluding the impact of taxes and interest on debt, which are less connected to business fundamentals.
AECOM was profitable over the last five years but held back by its large cost base. Its average operating margin of 4.5% was weak for an industrials business. This result isn’t too surprising given its low gross margin as a starting point.
Final Judgment
AECOM isn’t a terrible business, but it isn’t one of our picks. With its shares topping the market in recent months, the stock trades at 24.1× forward P/E (or $130.81 per share). This valuation is reasonable, but the company’s shakier fundamentals present too much downside risk. We're fairly confident there are better stocks to buy right now. Let us point you toward one of Charlie Munger’s all-time favorite businesses.
Stocks We Would Buy Instead of AECOM
Trump’s April 2025 tariff bombshell triggered a massive market selloff, but stocks have since staged an impressive recovery, leaving those who panic sold on the sidelines.
Take advantage of the rebound by checking out our Top 5 Strong Momentum Stocks for this week. This is a curated list of our High Quality stocks that have generated a market-beating return of 183% over the last five years (as of March 31st 2025).
Stocks that made our list in 2020 include now familiar names such as Nvidia (+1,545% between March 2020 and March 2025) as well as under-the-radar businesses like the once-small-cap company Comfort Systems (+782% five-year return). Find your next big winner with StockStory today.
StockStory is growing and hiring equity analyst and marketing roles. Are you a 0 to 1 builder passionate about the markets and AI? See the open roles here.


