
Online study and academic help platform Chegg (NYSE: CHGG) announced better-than-expected revenue in Q3 CY2025, but sales fell by 43.1% year on year to $77.74 million. On the other hand, next quarter’s revenue guidance of $71 million was less impressive, coming in 13.7% below analysts’ estimates. Its non-GAAP loss of $0 per share was significantly above analysts’ consensus estimates.
Is now the time to buy Chegg? Find out by accessing our full research report, it’s free for active Edge members.
Chegg (CHGG) Q3 CY2025 Highlights:
- Revenue: $77.74 million vs analyst estimates of $76.28 million (43.1% year-on-year decline, 1.9% beat)
- Adjusted EPS: $0 vs analyst estimates of -$0.08 (significant beat)
- Adjusted EBITDA: $13.25 million vs analyst estimates of $7.66 million (17% margin, 73% beat)
- Revenue Guidance for Q4 CY2025 is $71 million at the midpoint, below analyst estimates of $82.31 million
- EBITDA guidance for Q4 CY2025 is $10.5 million at the midpoint, below analyst estimates of $10.65 million
- Operating Margin: -22%, up from -163% in the same quarter last year
- Free Cash Flow was -$943,000 compared to -$12.07 million in the previous quarter
- Market Capitalization: $96.51 million
“This quarter marks an inflection point for Chegg with our recent decisive action to streamline our structure, strengthen our balance sheet, and focus Chegg on the large and growing skilling market,” said Dan Rosensweig, CEO and Executive Chairman of Chegg.
Company Overview
Started as a physical textbook rental service, Chegg (NYSE: CHGG) is now a digital platform addressing student pain points by providing study and academic assistance.
Revenue Growth
Examining a company’s long-term performance can provide clues about its quality. Any business can put up a good quarter or two, but the best consistently grow over the long haul. Over the last three years, Chegg’s demand was weak and its revenue declined by 16.5% per year. This was below our standards and is a sign of lacking business quality.
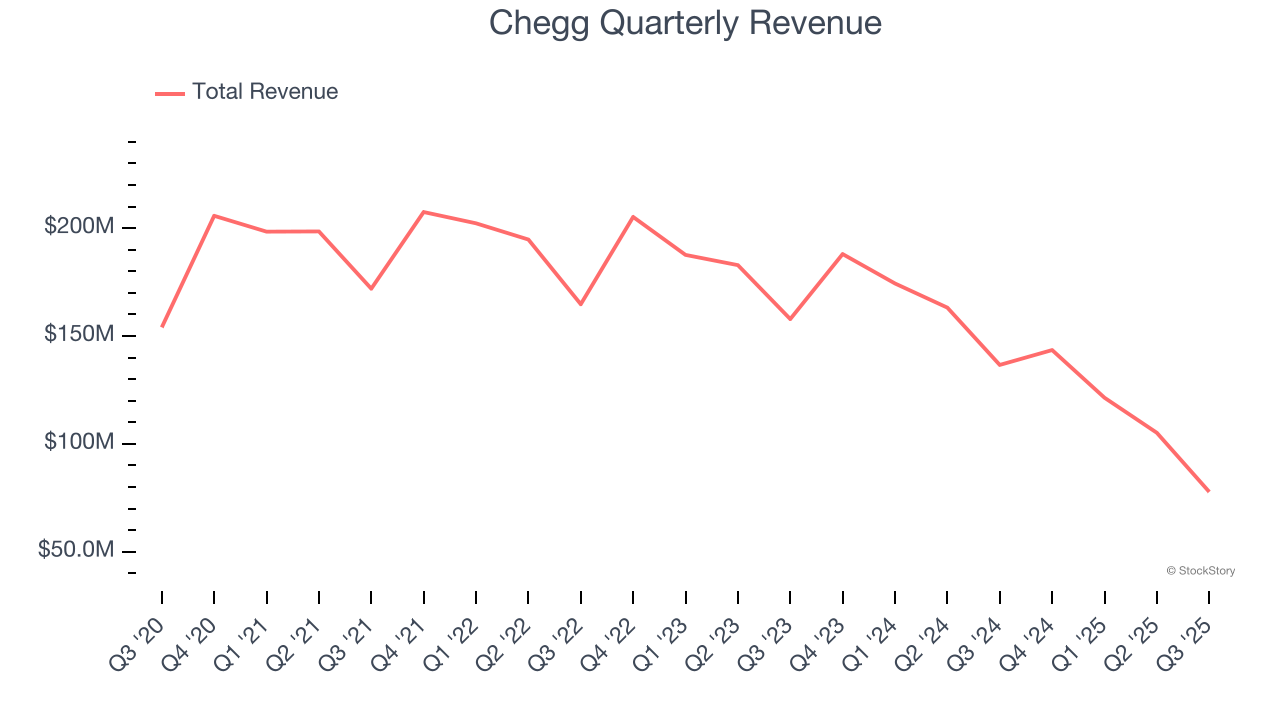
This quarter, Chegg’s revenue fell by 43.1% year on year to $77.74 million but beat Wall Street’s estimates by 1.9%. Company management is currently guiding for a 50.5% year-on-year decline in sales next quarter.
Looking further ahead, sell-side analysts expect revenue to decline by 29.1% over the next 12 months, a deceleration versus the last three years. This projection doesn't excite us and implies its products and services will face some demand challenges.
The 1999 book Gorilla Game predicted Microsoft and Apple would dominate tech before it happened. Its thesis? Identify the platform winners early. Today, enterprise software companies embedding generative AI are becoming the new gorillas. a profitable, fast-growing enterprise software stock that is already riding the automation wave and looking to catch the generative AI next.
Cash Is King
If you’ve followed StockStory for a while, you know we emphasize free cash flow. Why, you ask? We believe that in the end, cash is king, and you can’t use accounting profits to pay the bills.
Chegg has shown impressive cash profitability, driven by its attractive business model and cost-effective customer acquisition strategy that give it the option to invest in new products and services rather than sales and marketing. The company’s free cash flow margin averaged 9.4% over the last two years, better than the broader consumer internet sector.
Taking a step back, we can see that Chegg’s margin dropped by 16.5 percentage points over the last few years. If its declines continue, it could signal increasing investment needs and capital intensity.

Chegg burned through $943,000 of cash in Q3, equivalent to a negative 1.2% margin. The company’s cash flow turned negative after being positive in the same quarter last year, suggesting its historical struggles have dragged on.
Key Takeaways from Chegg’s Q3 Results
We were impressed by how significantly Chegg blew past analysts’ EBITDA expectations this quarter. We were also happy its revenue outperformed Wall Street’s estimates. On the other hand, its revenue guidance for next quarter missed and its EBITDA guidance for next quarter fell slightly short of Wall Street’s estimates. Overall, this quarter could have been better. The stock traded up 2.3% to $0.91 immediately following the results.
Should you buy the stock or not? What happened in the latest quarter matters, but not as much as longer-term business quality and valuation, when deciding whether to invest in this stock. We cover that in our actionable full research report which you can read here, it’s free for active Edge members.


