Fresh produce company Dole (NYSE: DOLE) reported revenue ahead of Wall Streets expectations in Q3 CY2025, with sales up 10.5% year on year to $2.28 billion. Its non-GAAP profit of $0.16 per share was in line with analysts’ consensus estimates.
Is now the time to buy Dole? Find out by accessing our full research report, it’s free for active Edge members.
Dole (DOLE) Q3 CY2025 Highlights:
- Revenue: $2.28 billion vs analyst estimates of $2.16 billion (10.5% year-on-year growth, 5.7% beat)
- Adjusted EPS: $0.16 vs analyst estimates of $0.17 (in line)
- Adjusted EBITDA: $80.77 million vs analyst estimates of $77.93 million (3.5% margin, 3.6% beat)
- EBITDA guidance for the full year is $385 million at the midpoint, below analyst estimates of $393.5 million
- Operating Margin: 1.1%, down from 2.4% in the same quarter last year
- Free Cash Flow Margin: 2.9%, similar to the same quarter last year
- Market Capitalization: $1.25 billion
1 Like-for-like basis refers to the measure excluding the impact of foreign currency translation movements and acquisitions and divestitures. Refer to the Appendix and "Supplemental Reconciliation of Prior Year Segment Results to Current Year Segment Results" for further detail on these impacts and the calculation of like-for-like basis variances.
Company Overview
Known for its delicious pineapples and Hawaiian roots, Dole (NYSE: DOLE) is a global agricultural company specializing in fresh fruits and vegetables.
Revenue Growth
A company’s long-term sales performance is one signal of its overall quality. Any business can have short-term success, but a top-tier one grows for years.
With $8.97 billion in revenue over the past 12 months, Dole is one of the larger consumer staples companies and benefits from a well-known brand that influences purchasing decisions. However, its scale is a double-edged sword because there are only so many big store chains to sell into, making it harder to find incremental growth. To expand meaningfully, Dole likely needs to tweak its prices, innovate with new products, or enter new markets.
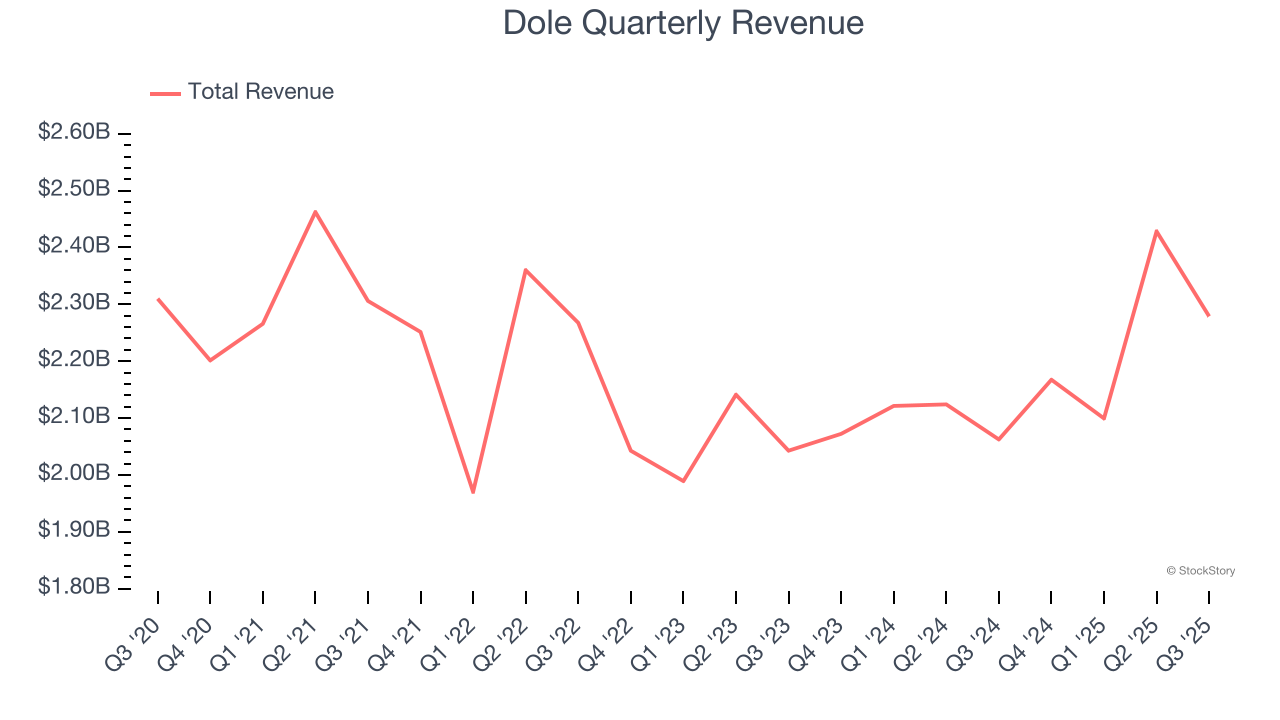
As you can see below, Dole struggled to increase demand as its $8.97 billion of sales for the trailing 12 months was close to its revenue three years ago. This shows demand was soft, a rough starting point for our analysis.

This quarter, Dole reported year-on-year revenue growth of 10.5%, and its $2.28 billion of revenue exceeded Wall Street’s estimates by 5.7%.
Looking ahead, sell-side analysts expect revenue to remain flat over the next 12 months. This projection is underwhelming and implies its newer products will not lead to better top-line performance yet.
While Wall Street chases Nvidia at all-time highs, an under-the-radar semiconductor supplier is dominating a critical AI component these giants can’t build without. Click here to access our free report one of our favorites growth stories.
Cash Is King
Free cash flow isn't a prominently featured metric in company financials and earnings releases, but we think it's telling because it accounts for all operating and capital expenses, making it tough to manipulate. Cash is king.
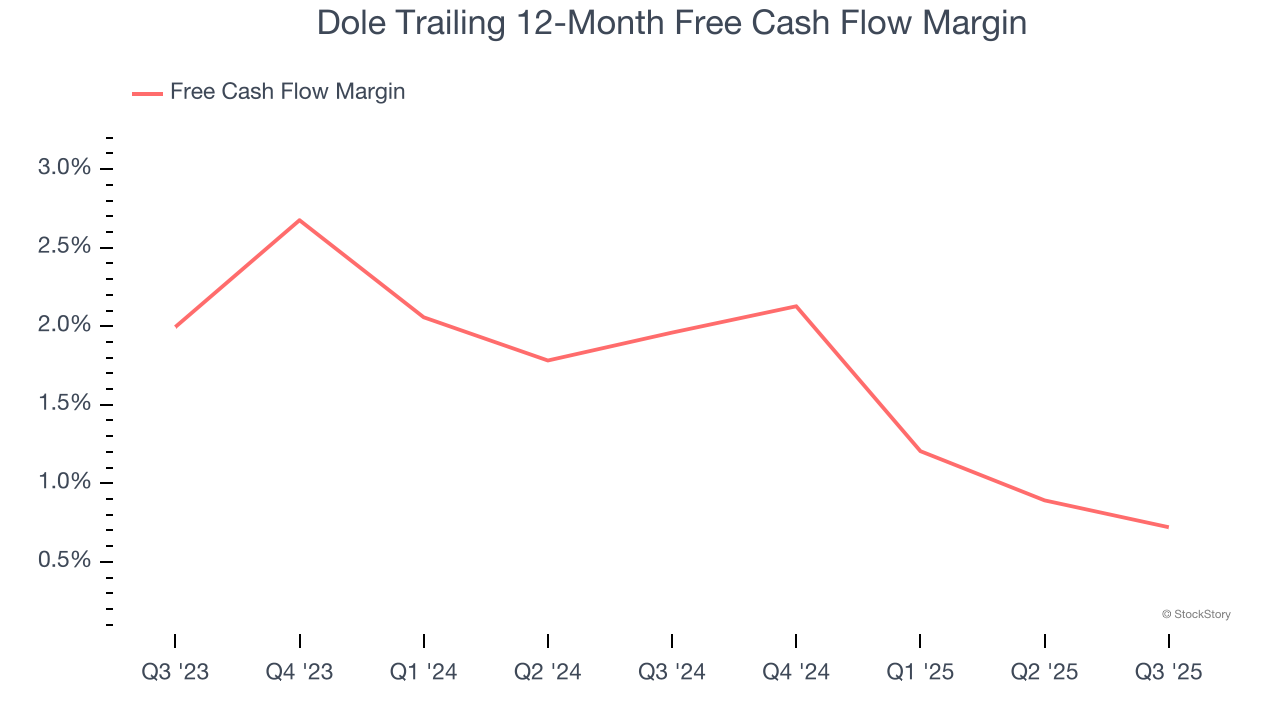
Dole has shown weak cash profitability over the last two years, giving the company limited opportunities to return capital to shareholders. Its free cash flow margin averaged 1.3%, subpar for a consumer staples business.
Taking a step back, we can see that Dole’s margin dropped by 1.2 percentage points over the last year. Almost any movement in the wrong direction is undesirable because of its already low cash conversion. If the trend continues, it could signal it’s in the middle of an investment cycle.

Dole’s free cash flow clocked in at $66.48 million in Q3, equivalent to a 2.9% margin. This cash profitability was in line with the comparable period last year and above its two-year average.
Key Takeaways from Dole’s Q3 Results
We enjoyed seeing Dole beat analysts’ revenue expectations this quarter. We were also happy its EBITDA outperformed Wall Street’s estimates. On the other hand, its EBITDA guidance fell short of Wall Street’s estimates. Zooming out, we think this was a mixed quarter. The stock traded up 3.2% to $13.55 immediately after reporting.
Is Dole an attractive investment opportunity at the current price? What happened in the latest quarter matters, but not as much as longer-term business quality and valuation, when deciding whether to invest in this stock. We cover that in our actionable full research report which you can read here, it’s free for active Edge members.


