
Global media and entertainment company iHeartMedia (NASDAQ: IHRT) announced better-than-expected revenue in Q3 CY2025, but sales fell by 1.1% year on year to $997 million. Its GAAP loss of $0.43 per share was significantly below analysts’ consensus estimates.
Is now the time to buy iHeartMedia? Find out by accessing our full research report, it’s free for active Edge members.
iHeartMedia (IHRT) Q3 CY2025 Highlights:
- Revenue: $997 million vs analyst estimates of $978.7 million (1.1% year-on-year decline, 1.9% beat)
- EPS (GAAP): -$0.43 vs analyst estimates of -$0.01 (significant miss)
- Adjusted EBITDA: $204.8 million vs analyst estimates of $203.3 million (20.5% margin, 0.7% beat)
- Operating Margin: -11.7%, down from 7.6% in the same quarter last year
- Free Cash Flow was -$32.82 million, down from $73.35 million in the same quarter last year
- Market Capitalization: $652.2 million
Company Overview
Occasionally featuring celebrity hosts like Ryan Seacrest on its shows, iHeartMedia (NASDAQ: IHRT) is a leading multimedia company renowned for its extensive network of radio stations, digital platforms, and live events across the globe.
Revenue Growth
A company’s long-term performance is an indicator of its overall quality. Any business can put up a good quarter or two, but the best consistently grow over the long haul. Over the last five years, iHeartMedia grew its sales at a sluggish 4.9% compounded annual growth rate. This was below our standard for the consumer discretionary sector and is a poor baseline for our analysis.
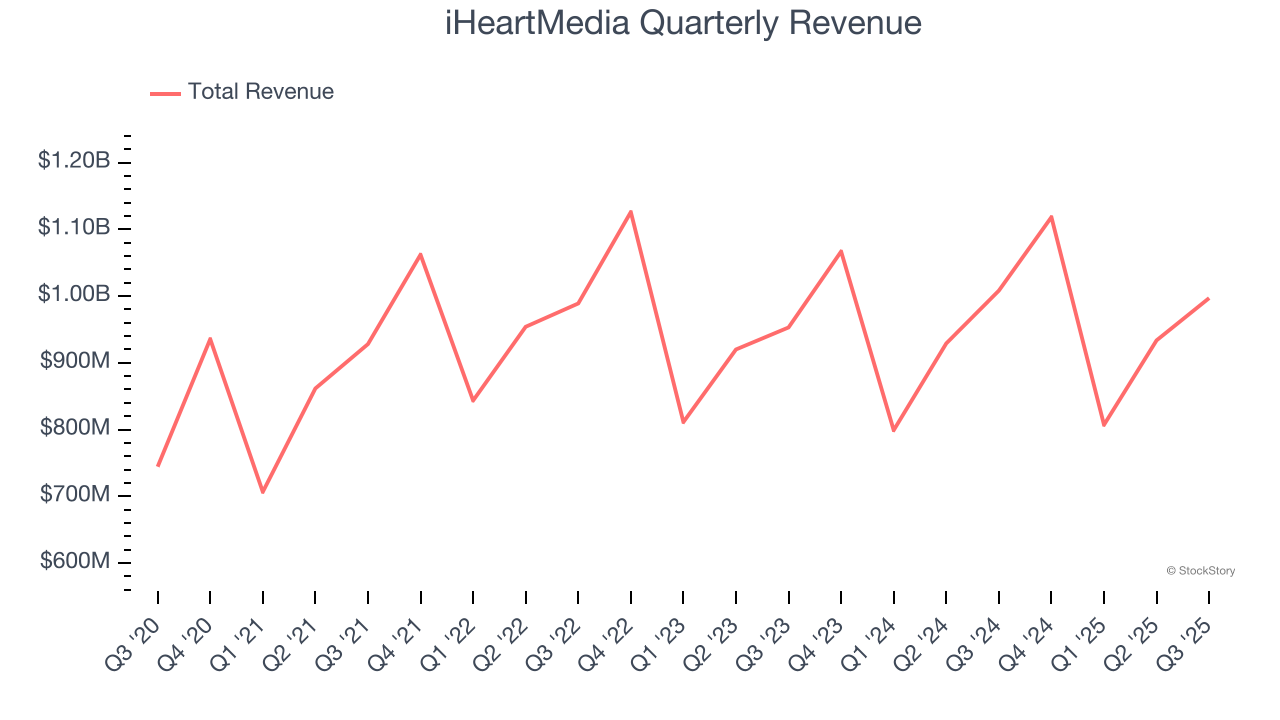
We at StockStory place the most emphasis on long-term growth, but within consumer discretionary, a stretched historical view may miss a company riding a successful new product or trend. iHeartMedia’s recent performance shows its demand has slowed as its revenue was flat over the last two years. 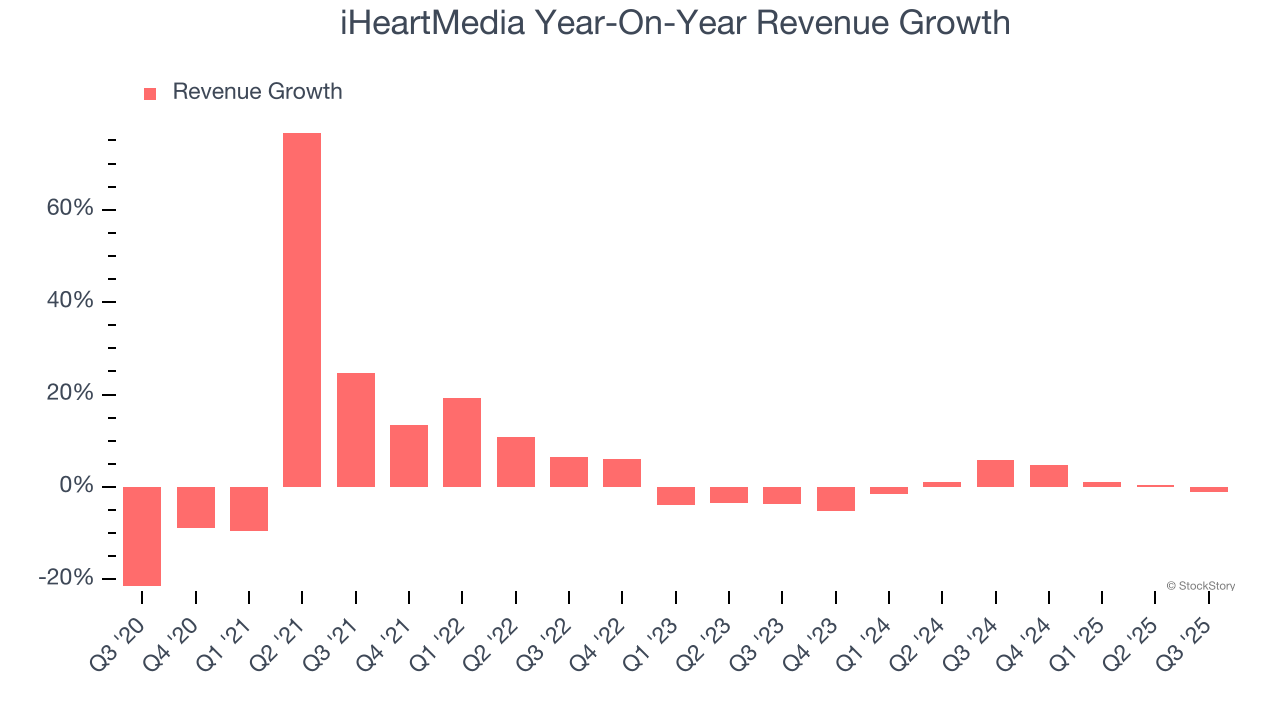
We can dig further into the company’s revenue dynamics by analyzing its three most important segments: Multiplatform, Digital Audio, and Services, which are 59.3%, 34.3%, and 6.7% of revenue. Over the last two years, iHeartMedia’s Multiplatform revenue (broadcasting, networks, events) averaged 4% year-on-year declines, but its Digital Audio (podcasting) and Services (media representation) revenues averaged 10.5% and 4.6% growth. 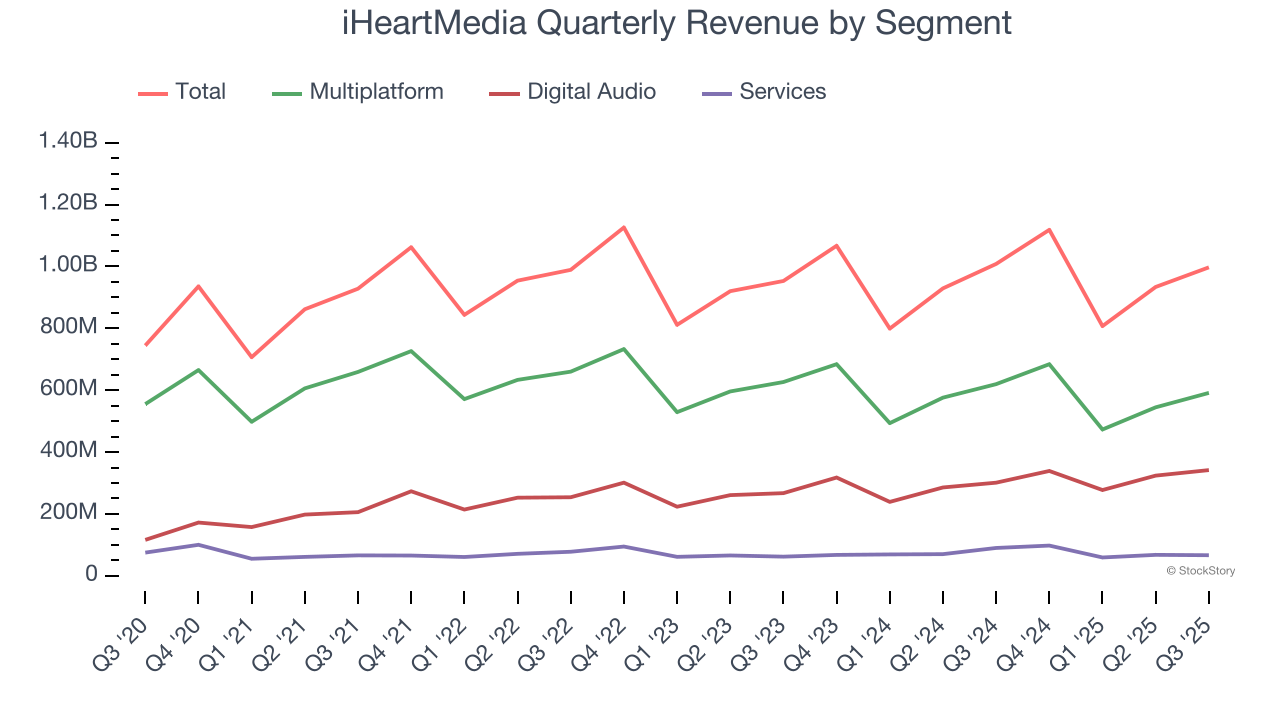
This quarter, iHeartMedia’s revenue fell by 1.1% year on year to $997 million but beat Wall Street’s estimates by 1.9%.
Looking ahead, sell-side analysts expect revenue to grow 2% over the next 12 months, similar to its two-year rate. Although this projection implies its newer products and services will spur better top-line performance, it is still below average for the sector.
Software is eating the world and there is virtually no industry left that has been untouched by it. That drives increasing demand for tools helping software developers do their jobs, whether it be monitoring critical cloud infrastructure, integrating audio and video functionality, or ensuring smooth content streaming. Click here to access a free report on our 3 favorite stocks to play this generational megatrend.
Operating Margin
Operating margin is a key measure of profitability. Think of it as net income - the bottom line - excluding the impact of taxes and interest on debt, which are less connected to business fundamentals.
iHeartMedia’s operating margin has risen over the last 12 months, but it still averaged negative 10.3% over the last two years. This is due to its large expense base and inefficient cost structure.
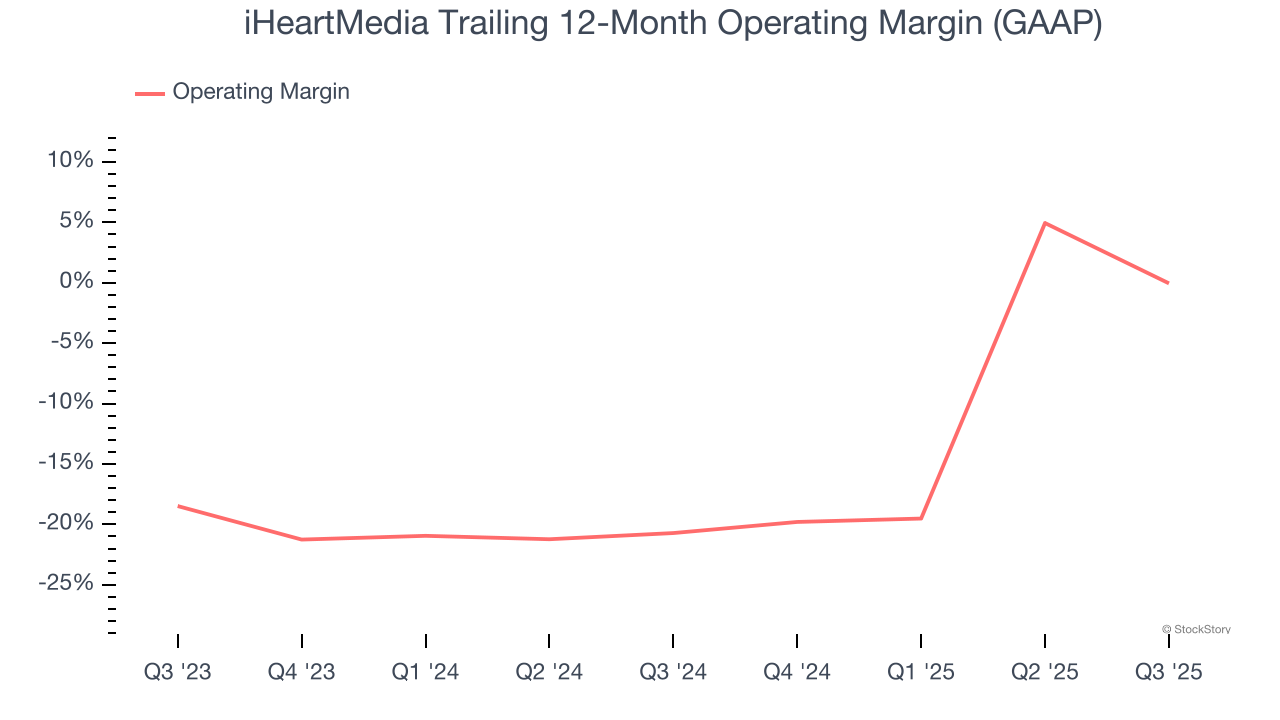
In Q3, iHeartMedia generated a negative 11.7% operating margin. The company's consistent lack of profits raise a flag.
Earnings Per Share
We track the long-term change in earnings per share (EPS) for the same reason as long-term revenue growth. Compared to revenue, however, EPS highlights whether a company’s growth is profitable.
Although iHeartMedia’s full-year earnings are still negative, it reduced its losses and improved its EPS by 27.2% annually over the last five years. The next few quarters will be critical for assessing its long-term profitability.
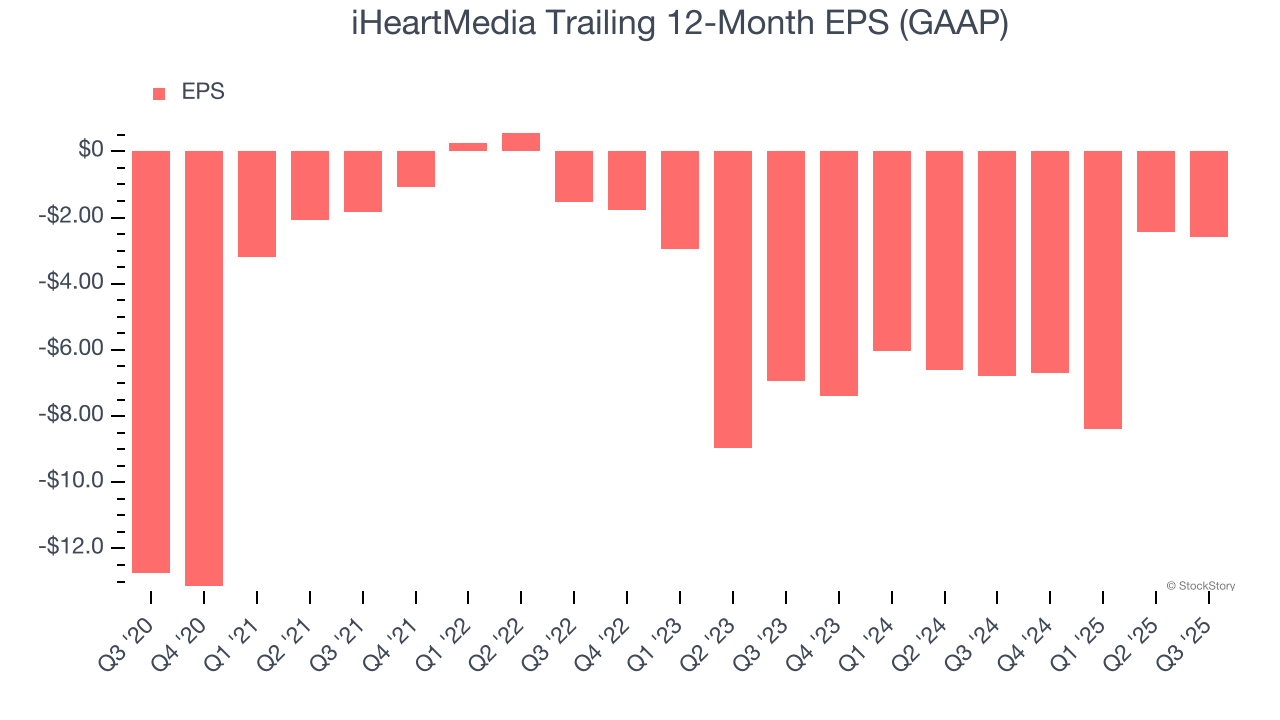
In Q3, iHeartMedia reported EPS of negative $0.43, down from negative $0.27 in the same quarter last year. This print missed analysts’ estimates. Over the next 12 months, Wall Street is optimistic. Analysts forecast iHeartMedia’s full-year EPS of negative $2.60 will flip to positive $0.22.
Key Takeaways from iHeartMedia’s Q3 Results
It was encouraging to see iHeartMedia beat analysts’ revenue expectations this quarter. We were also happy its Digital Audio revenue narrowly outperformed Wall Street’s estimates. On the other hand, its EPS missed. Overall, this was a softer quarter. The stock traded down 6.6% to $4.24 immediately following the results.
iHeartMedia’s earnings report left more to be desired. Let’s look forward to see if this quarter has created an opportunity to buy the stock. What happened in the latest quarter matters, but not as much as longer-term business quality and valuation, when deciding whether to invest in this stock. We cover that in our actionable full research report which you can read here, it’s free for active Edge members.


