
Since November 2020, the S&P 500 has delivered a total return of 91.1%. But one standout stock has nearly doubled the market - over the past five years, FirstCash has surged 165% to $161.38 per share. Its momentum hasn’t stopped as it’s also gained 22.1% in the last six months thanks to its solid quarterly results, beating the S&P by 5.2%.
Is there a buying opportunity in FirstCash, or does it present a risk to your portfolio? Get the full breakdown from our expert analysts, it’s free for active Edge members.
Why Is FirstCash Not Exciting?
Despite the momentum, we're cautious about FirstCash. Here are two reasons you should be careful with FCFS and a stock we'd rather own.
1. Lackluster Revenue Growth
We at StockStory place the most emphasis on long-term growth, but within financials, a stretched historical view may miss recent interest rate changes, market returns, and industry trends. FirstCash’s recent performance shows its demand has slowed significantly as its annualized revenue growth of 6.9% over the last two years was well below its five-year trend. 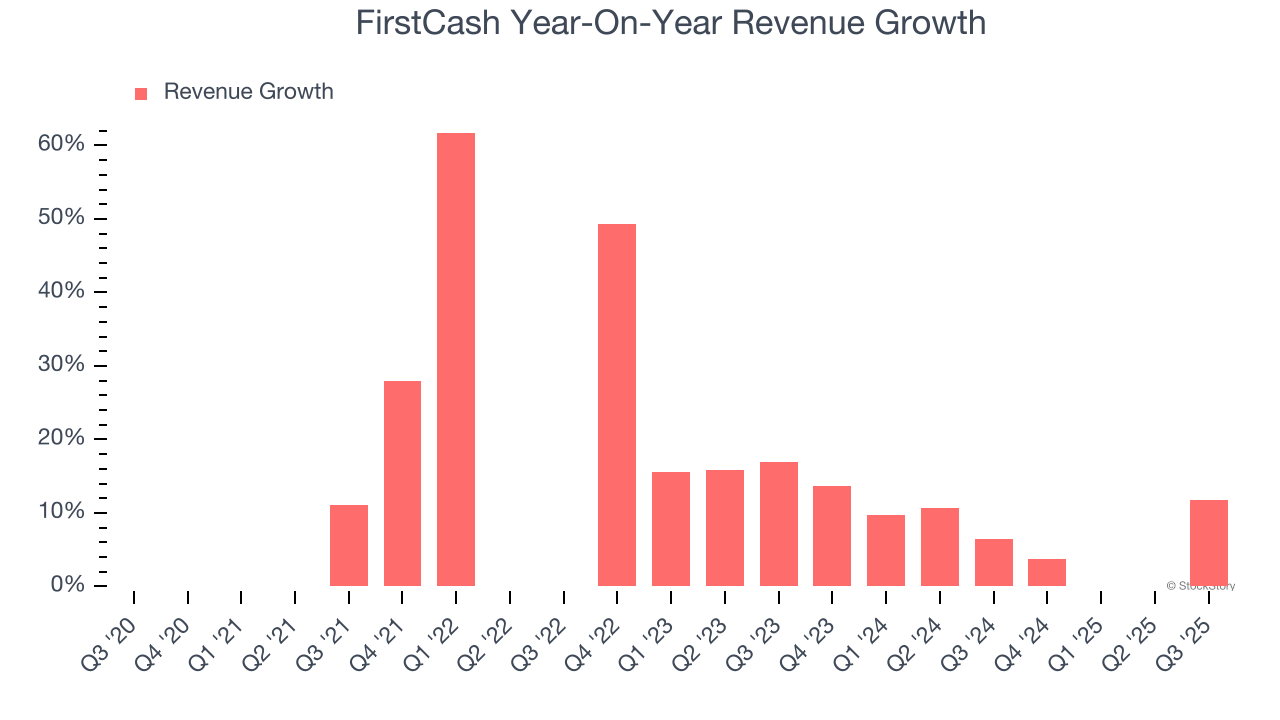 Note: Quarters not shown were determined to be outliers, impacted by outsized investment gains/losses that are not indicative of the recurring fundamentals of the business.
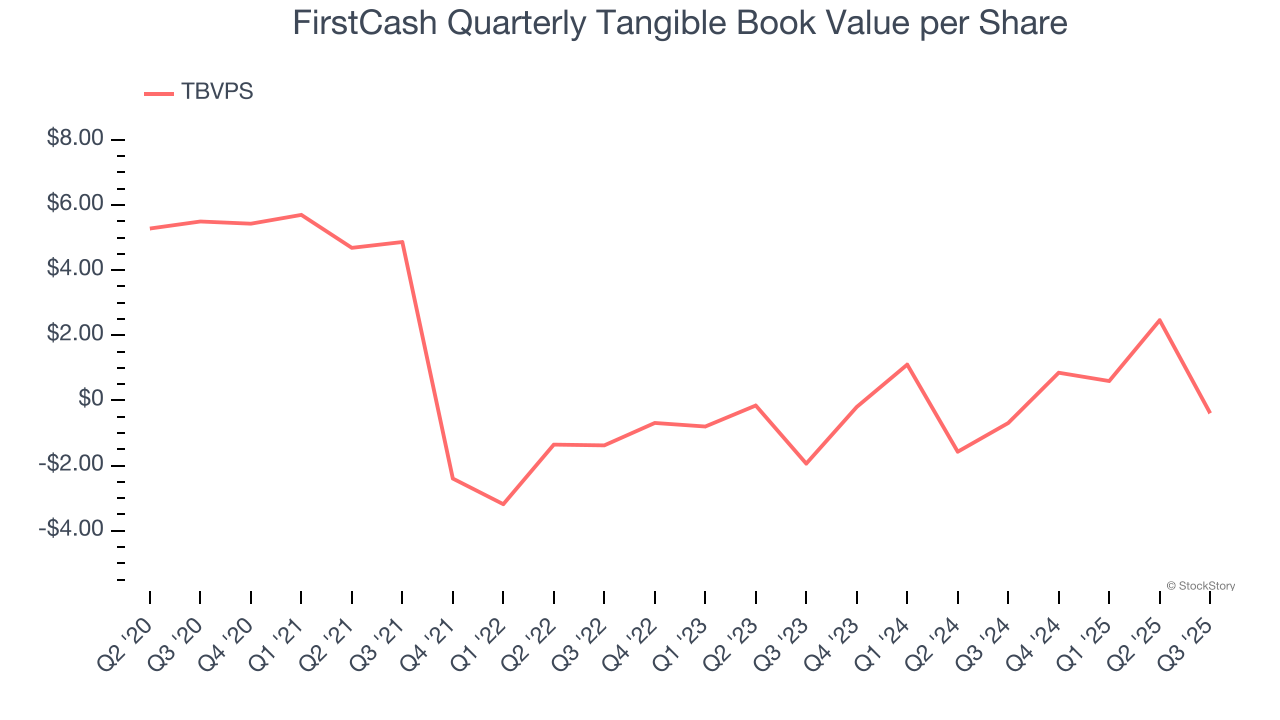
2. Declining TBVPS Reflects Erosion of Asset Value
Tangible book value per share (TBVPS) is a crucial metric that measures the actual value of shareholders’ equity, stripping out goodwill and other intangible assets that may not be recoverable in a worst-case scenario.
Disappointingly for investors, FirstCash’s TBVPS declined at a 55% annual clip over the last two years.
Final Judgment
FirstCash isn’t a terrible business, but it isn’t one of our picks. With its shares outperforming the market lately, the stock trades at 16.6× forward P/E (or $161.38 per share). Beauty is in the eye of the beholder, but we don’t really see a big opportunity at the moment. We're pretty confident there are more exciting stocks to buy at the moment. Let us point you toward one of Charlie Munger’s all-time favorite businesses.
High-Quality Stocks for All Market Conditions
Fresh US-China trade tensions just tanked stocks—but strong bank earnings are fueling a sharp rebound. Don’t miss the bounce.
Don’t let fear keep you from great opportunities and take a look at Top 5 Strong Momentum Stocks for this week. This is a curated list of our High Quality stocks that have generated a market-beating return of 183% over the last five years (as of March 31st 2025).
Stocks that made our list in 2020 include now familiar names such as Nvidia (+1,545% between March 2020 and March 2025) as well as under-the-radar businesses like the once-small-cap company Comfort Systems (+782% five-year return). Find your next big winner with StockStory today.
StockStory is growing and hiring equity analyst and marketing roles. Are you a 0 to 1 builder passionate about the markets and AI? See the open roles here.