
Since May 2025, PVH has been in a holding pattern, posting a small loss of 3.1% while floating around $76.53. The stock also fell short of the S&P 500’s 16.9% gain during that period.
Is there a buying opportunity in PVH, or does it present a risk to your portfolio? Get the full stock story straight from our expert analysts, it’s free for active Edge members.
Why Do We Think PVH Will Underperform?
We're swiping left on PVH for now. Here are three reasons there are better opportunities than PVH and a stock we'd rather own.
1. Declining Constant Currency Revenue, Demand Takes a Hit
Investors interested in Apparel and Accessories companies should track constant currency revenue in addition to reported revenue. This metric excludes currency movements, which are outside of PVH’s control and are not indicative of underlying demand.
Over the last two years, PVH’s constant currency revenue averaged 2.4% year-on-year declines. This performance was underwhelming and implies there may be increasing competition or market saturation. It also suggests PVH might have to lower prices or invest in product improvements to accelerate growth, factors that can hinder near-term profitability. 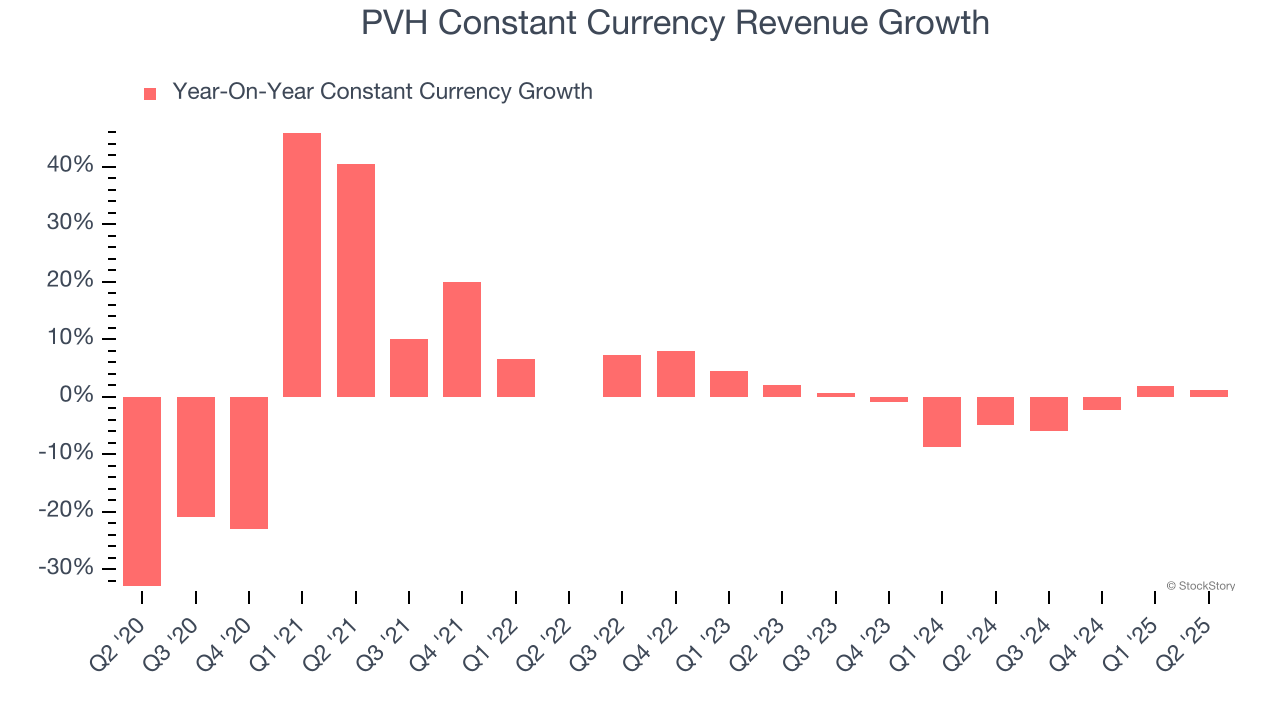
2. Projected Revenue Growth Is Slim
Forecasted revenues by Wall Street analysts signal a company’s potential. Predictions may not always be accurate, but accelerating growth typically boosts valuation multiples and stock prices while slowing growth does the opposite.
Over the next 12 months, sell-side analysts expect PVH’s revenue to rise by 2.5%. While this projection suggests its newer products and services will fuel better top-line performance, it is still below the sector average.
3. Previous Growth Initiatives Haven’t Impressed
Growth gives us insight into a company’s long-term potential, but how capital-efficient was that growth? Enter ROIC, a metric showing how much operating profit a company generates relative to the money it has raised (debt and equity).
PVH historically did a mediocre job investing in profitable growth initiatives. Its five-year average ROIC was 1.3%, lower than the typical cost of capital (how much it costs to raise money) for consumer discretionary companies.

Final Judgment
We cheer for all companies serving everyday consumers, but in the case of PVH, we’ll be cheering from the sidelines. With its shares lagging the market recently, the stock trades at 6.8× forward P/E (or $76.53 per share). While this valuation is optically cheap, the potential downside is huge given its shaky fundamentals. There are superior stocks to buy right now. Let us point you toward one of our all-time favorite software stocks.
High-Quality Stocks for All Market Conditions
Fresh US-China trade tensions just tanked stocks—but strong bank earnings are fueling a sharp rebound. Don’t miss the bounce.
Don’t let fear keep you from great opportunities and take a look at Top 9 Market-Beating Stocks. This is a curated list of our High Quality stocks that have generated a market-beating return of 183% over the last five years (as of March 31st 2025).
Stocks that made our list in 2020 include now familiar names such as Nvidia (+1,545% between March 2020 and March 2025) as well as under-the-radar businesses like the once-micro-cap company Tecnoglass (+1,754% five-year return). Find your next big winner with StockStory today.
StockStory is growing and hiring equity analyst and marketing roles. Are you a 0 to 1 builder passionate about the markets and AI? See the open roles here.