
Since May 2025, Radian Group has been in a holding pattern, posting a small return of 3.9% while floating around $35.33. The stock also fell short of the S&P 500’s 16.9% gain during that period.
Is now the time to buy Radian Group, or should you be careful about including it in your portfolio? Check out our in-depth research report to see what our analysts have to say, it’s free for active Edge members.
Why Is Radian Group Not Exciting?
We don't have much confidence in Radian Group. Here are three reasons you should be careful with RDN and a stock we'd rather own.
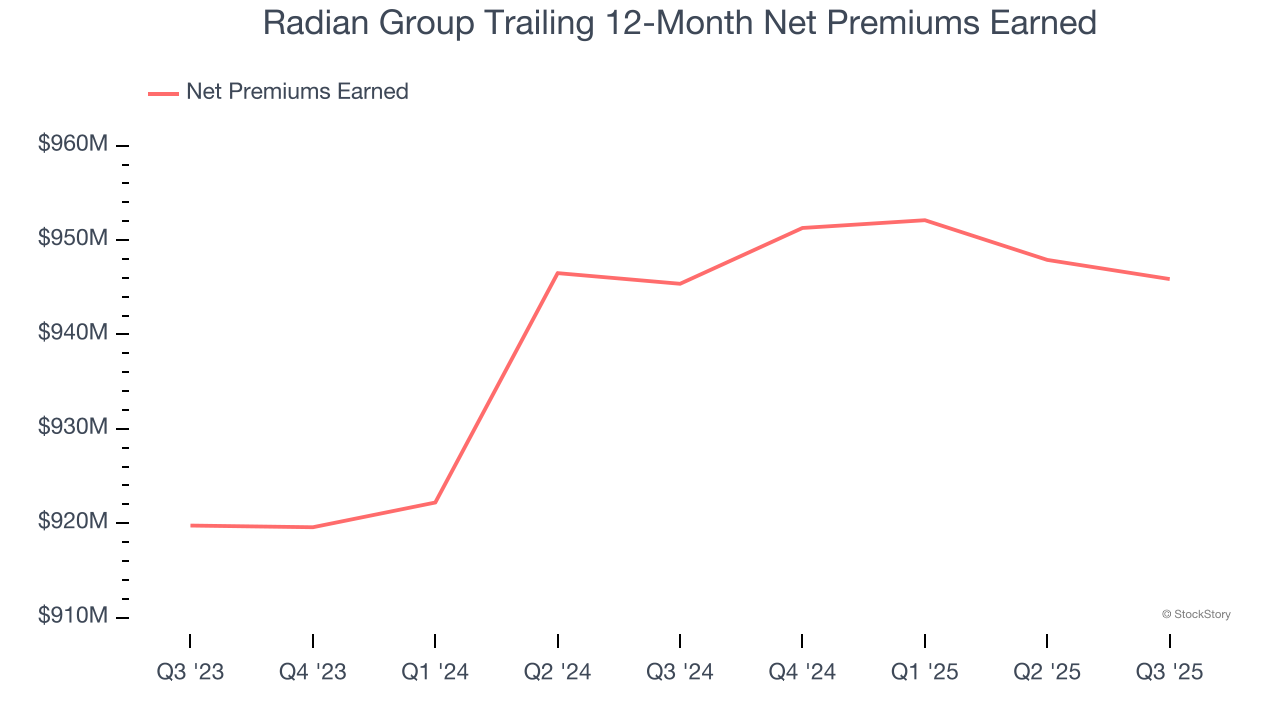
1. Declining Net Premiums Earned Reflect Weakness
When insurers sell policies, they protect themselves from extremely large losses or an outsized accumulation of losses with reinsurance (insurance for insurance companies). Net premiums earned are therefore gross premiums less what’s ceded to reinsurers as a risk mitigation and transfer strategy.
Radian Group’s net premiums earned has declined by 3.2% annually over the last five years, much worse than the broader insurance industry and in line with its total revenue.
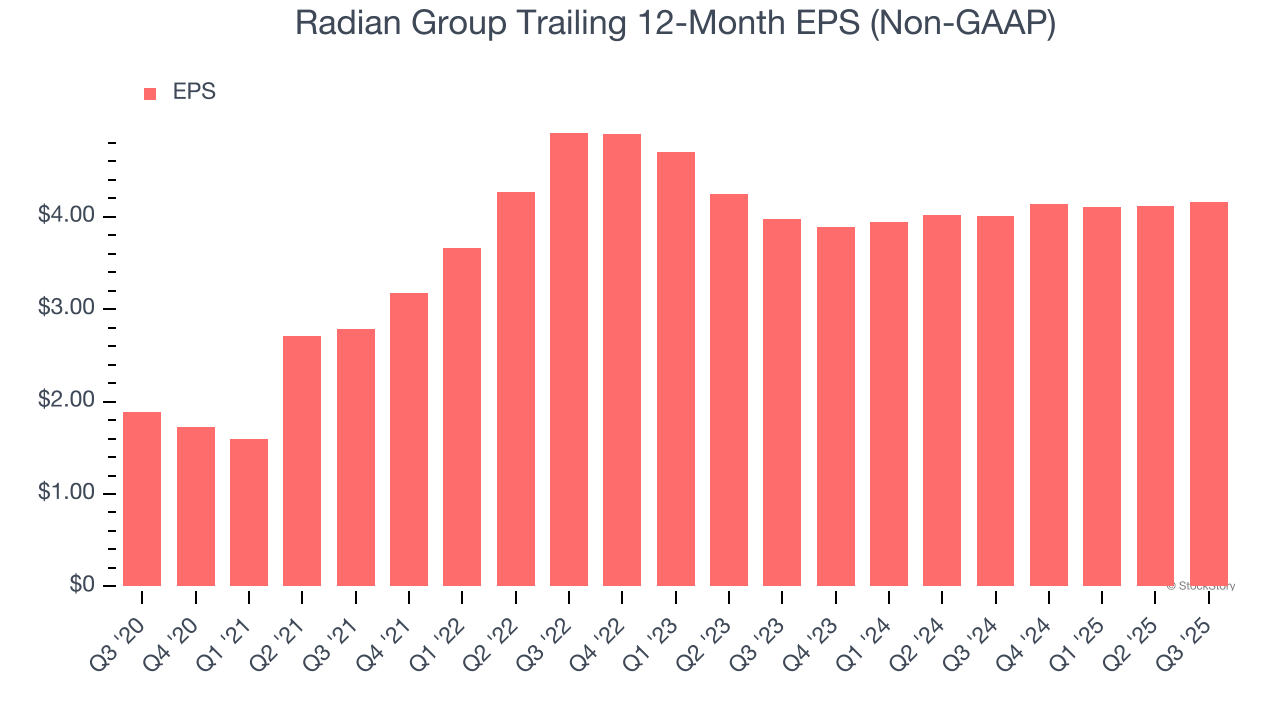
3. Recent EPS Growth Below Our Standards
Although long-term earnings trends give us the big picture, we like to analyze EPS over a shorter period to see if we are missing a change in the business.
Radian Group’s EPS grew at a weak 2.2% compounded annual growth rate over the last two years. On the bright side, this performance was higher than its 1.5% annualized revenue declines and tells us management adapted its cost structure in response to a challenging demand environment.
Final Judgment
Radian Group’s business quality ultimately falls short of our standards. With its shares trailing the market in recent months, the stock trades at 1× forward P/B (or $35.33 per share). This valuation multiple is fair, but we don’t have much faith in the company. We're fairly confident there are better investments elsewhere. Let us point you toward a safe-and-steady industrials business benefiting from an upgrade cycle.
High-Quality Stocks for All Market Conditions
Fresh US-China trade tensions just tanked stocks—but strong bank earnings are fueling a sharp rebound. Don’t miss the bounce.
Don’t let fear keep you from great opportunities and take a look at Top 9 Market-Beating Stocks. This is a curated list of our High Quality stocks that have generated a market-beating return of 183% over the last five years (as of March 31st 2025).
Stocks that made our list in 2020 include now familiar names such as Nvidia (+1,545% between March 2020 and March 2025) as well as under-the-radar businesses like the once-small-cap company Exlservice (+354% five-year return). Find your next big winner with StockStory today.
StockStory is growing and hiring equity analyst and marketing roles. Are you a 0 to 1 builder passionate about the markets and AI? See the open roles here.