Although Crane (currently trading at $189.45 per share) has gained 8% over the last six months, it has trailed the S&P 500’s 16.9% return during that period. This might have investors contemplating their next move.
Is there a buying opportunity in Crane, or does it present a risk to your portfolio? Dive into our full research report to see our analyst team’s opinion, it’s free for active Edge members.
Why Is Crane Not Exciting?
We don't have much confidence in Crane. Here are three reasons why CR doesn't excite us and a stock we'd rather own.
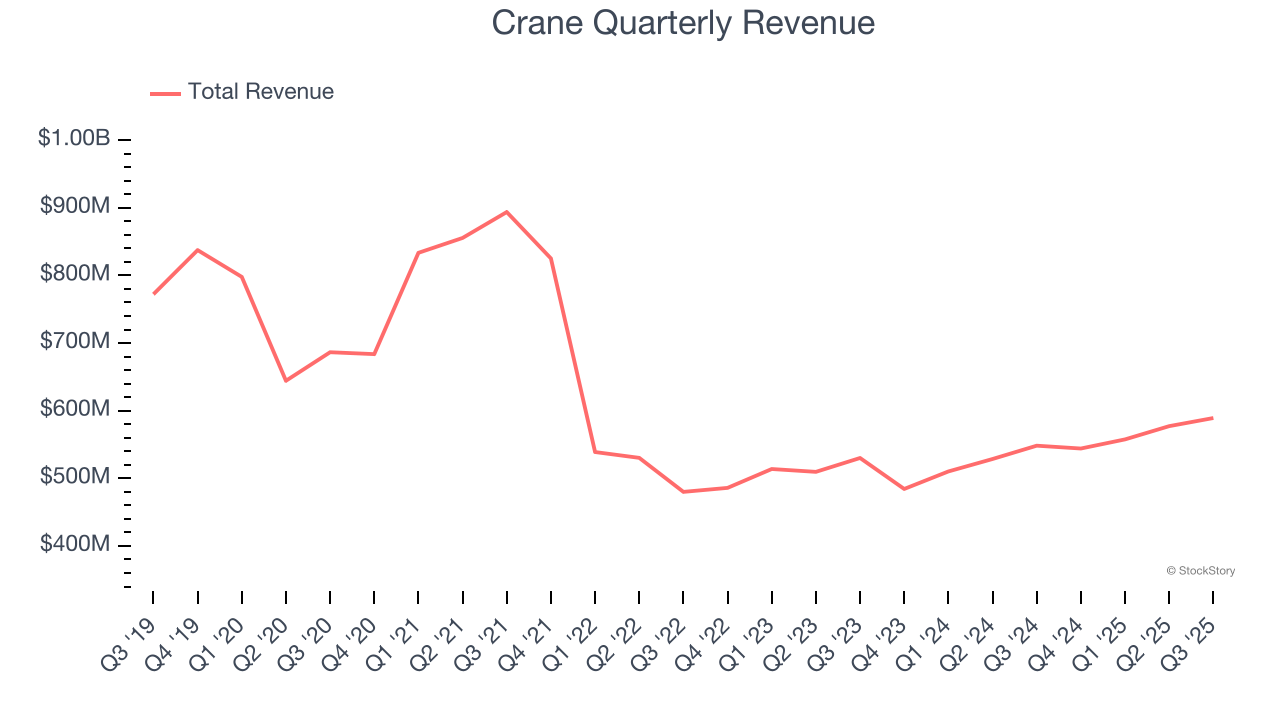
1. Revenue Spiraling Downwards
A company’s long-term performance is an indicator of its overall quality. Any business can have short-term success, but a top-tier one grows for years. Over the last five years, Crane’s demand was weak and its revenue declined by 5.2% per year. This was below our standards and is a sign of lacking business quality.
2. Slow Organic Growth Suggests Waning Demand In Core Business
We can better understand General Industrial Machinery companies by analyzing their organic revenue. This metric gives visibility into Crane’s core business because it excludes one-time events such as mergers, acquisitions, and divestitures along with foreign currency fluctuations - non-fundamental factors that can manipulate the income statement.
Over the last two years, Crane’s organic revenue averaged 6.6% year-on-year growth. This performance slightly lagged the sector and suggests it may need to improve its products, pricing, or go-to-market strategy, which can add an extra layer of complexity to its operations. 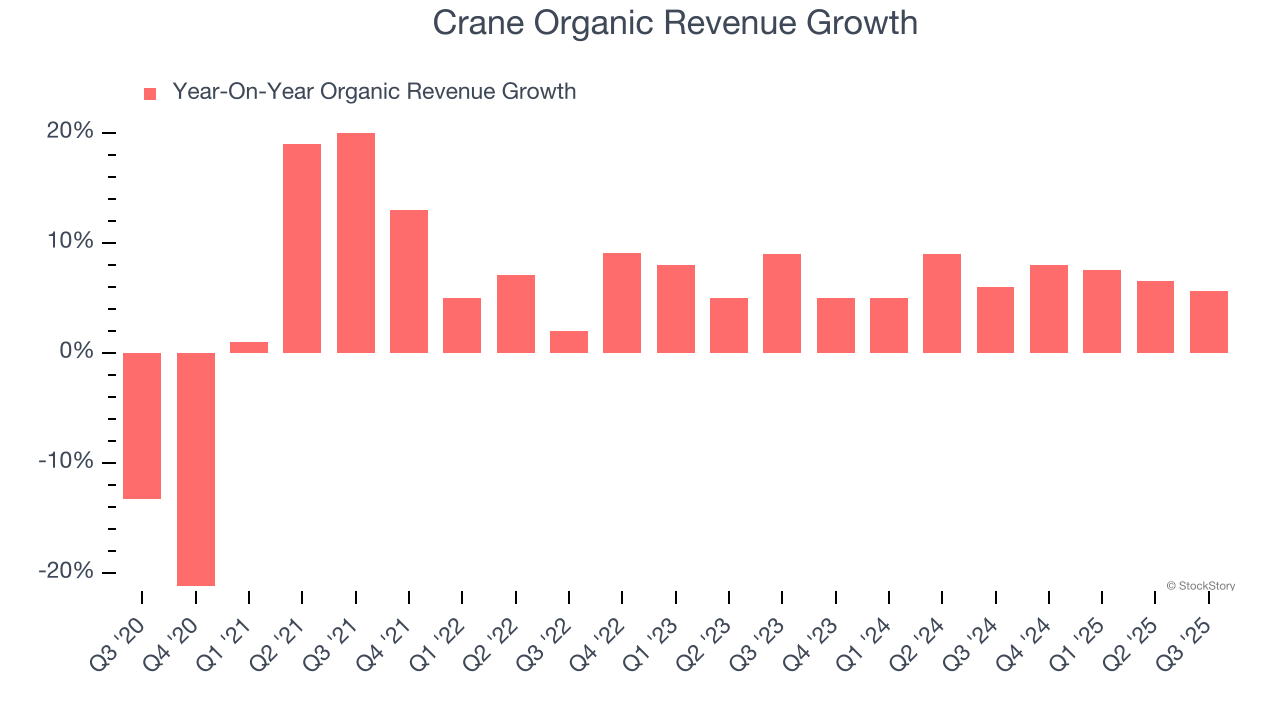
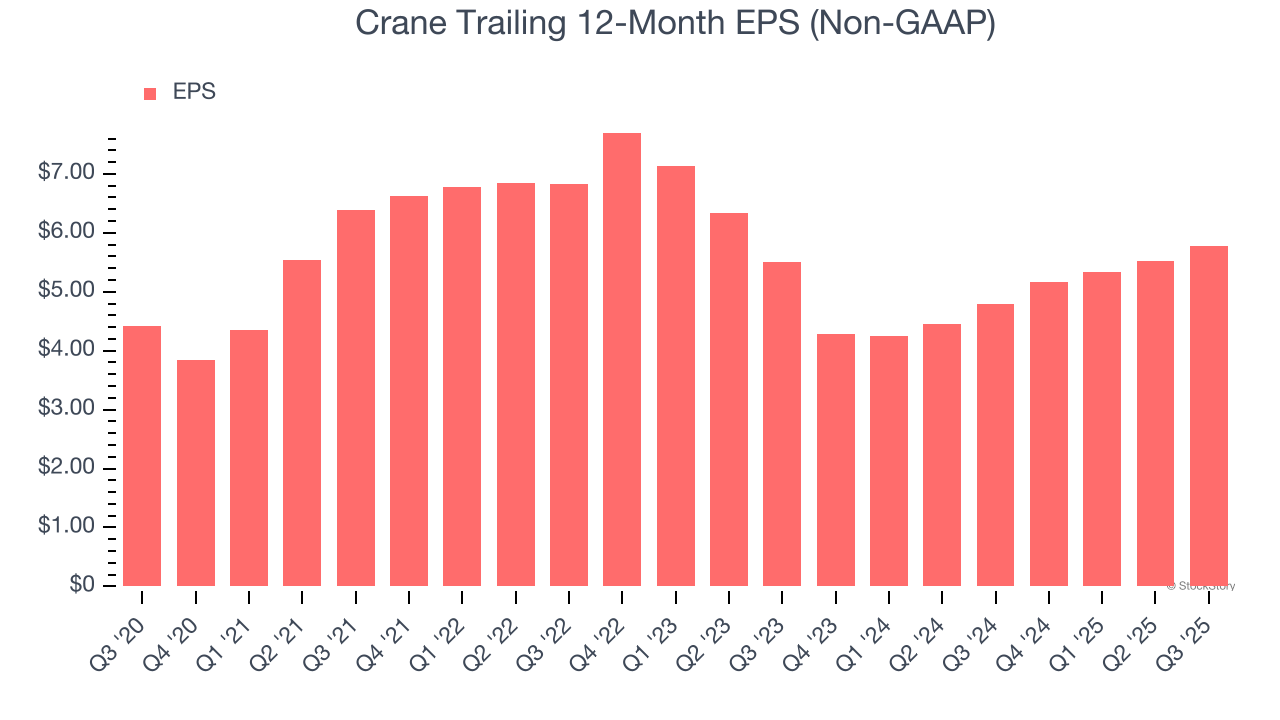
3. EPS Barely Growing
Analyzing the long-term change in earnings per share (EPS) shows whether a company's incremental sales were profitable – for example, revenue could be inflated through excessive spending on advertising and promotions.
Crane’s EPS grew at an unimpressive 5.5% compounded annual growth rate over the last five years. On the bright side, this performance was better than its 5.2% annualized revenue declines and tells us management adapted its cost structure in response to a challenging demand environment.
Final Judgment
Crane isn’t a terrible business, but it doesn’t pass our quality test. With its shares trailing the market in recent months, the stock trades at 30.5× forward P/E (or $189.45 per share). This valuation tells us a lot of optimism is priced in - we think there are better opportunities elsewhere. We’d suggest looking at a safe-and-steady industrials business benefiting from an upgrade cycle.
Stocks We Would Buy Instead of Crane
Trump’s April 2025 tariff bombshell triggered a massive market selloff, but stocks have since staged an impressive recovery, leaving those who panic sold on the sidelines.
Take advantage of the rebound by checking out our Top 9 Market-Beating Stocks. This is a curated list of our High Quality stocks that have generated a market-beating return of 183% over the last five years (as of March 31st 2025).
Stocks that made our list in 2020 include now familiar names such as Nvidia (+1,545% between March 2020 and March 2025) as well as under-the-radar businesses like the once-micro-cap company Tecnoglass (+1,754% five-year return). Find your next big winner with StockStory today.
StockStory is growing and hiring equity analyst and marketing roles. Are you a 0 to 1 builder passionate about the markets and AI? See the open roles here.