
Wrapping up Q3 earnings, we look at the numbers and key takeaways for the custody bank stocks, including StepStone Group (NASDAQ: STEP) and its peers.
Custody banks safeguard financial assets and provide services like settlement, accounting, and regulatory compliance for institutional investors. Growth opportunities stem from increasing global assets under custody, demand for data analytics, and blockchain technology adoption for settlement efficiency. Challenges include fee pressure from large clients, substantial technology investment requirements, and competition from both traditional players and fintech firms entering the space.
The 16 custody bank stocks we track reported a strong Q3. As a group, revenues beat analysts’ consensus estimates by 3.2%.
In light of this news, share prices of the companies have held steady as they are up 2.3% on average since the latest earnings results.
StepStone Group (NASDAQ: STEP)
Operating as both an advisor and asset manager with over $100 billion in assets under management, StepStone Group (NASDAQ: STEP) is an investment firm that provides clients with access to private market investments across private equity, real estate, private debt, and infrastructure.
StepStone Group reported revenues of $282.3 million, up 35.2% year on year. This print exceeded analysts’ expectations by 6.4%. Overall, it was an exceptional quarter for the company with an impressive beat of analysts’ management fees estimates and a solid beat of analysts’ revenue estimates.
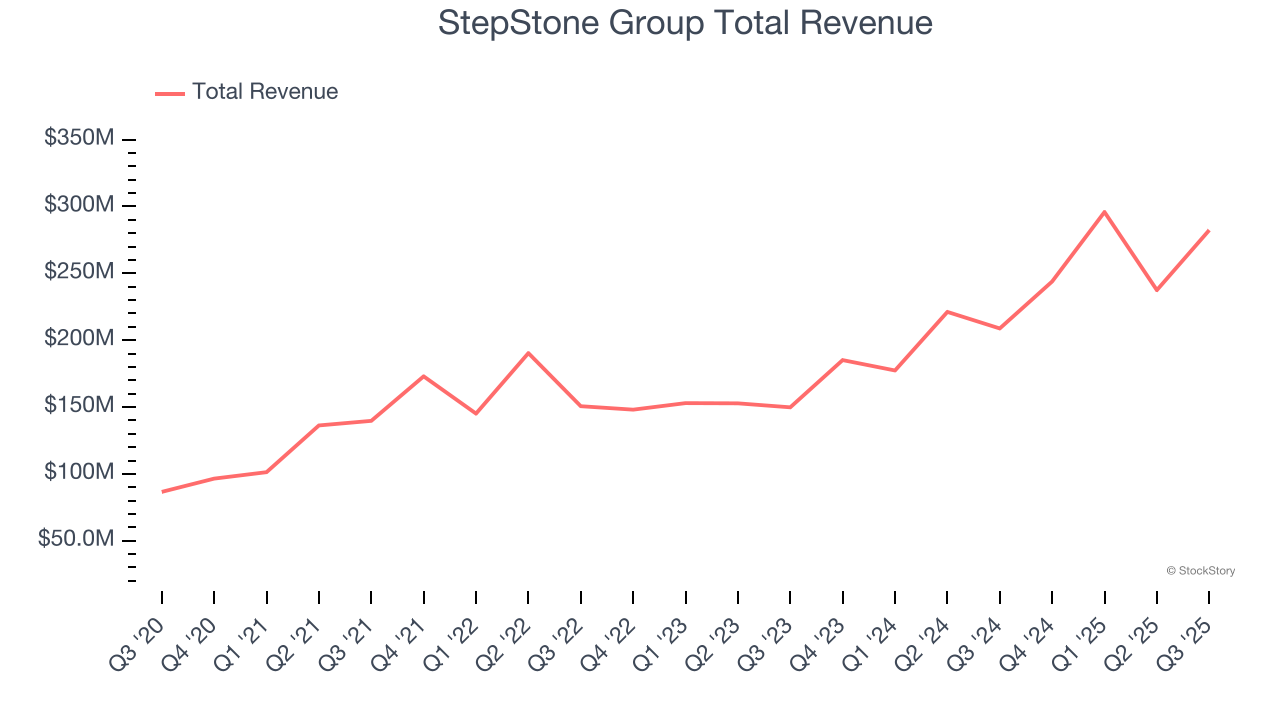
StepStone Group achieved the fastest revenue growth of the whole group. Unsurprisingly, the stock is up 2.8% since reporting and currently trades at $63.92.
Best Q3: Hamilton Lane (NASDAQ: HLNE)
With over $100 billion in assets under management and supervision, Hamilton Lane (NASDAQ: HLNE) is an investment management firm that specializes in private markets, offering advisory services and fund solutions to institutional and private wealth investors.
Hamilton Lane reported revenues of $190.9 million, up 27.3% year on year, outperforming analysts’ expectations by 12.8%. The business had an incredible quarter with a beat of analysts’ EPS estimates and a solid beat of analysts’ revenue estimates.
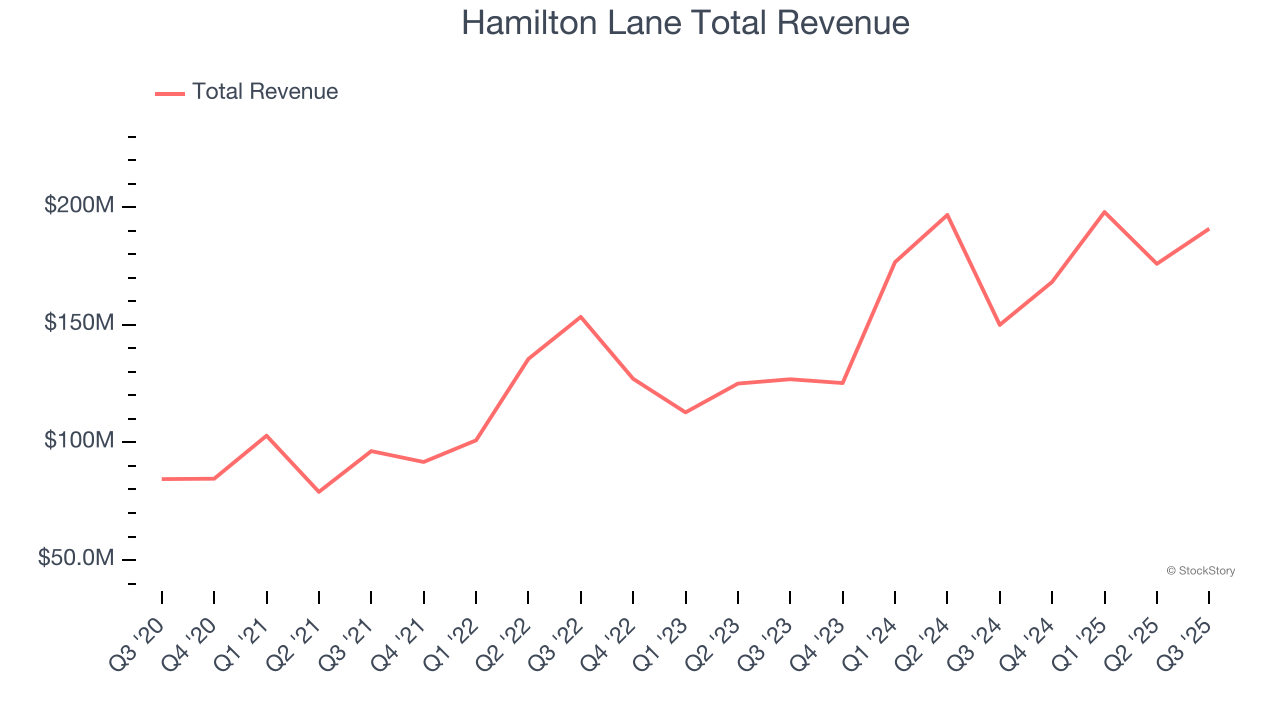
The market seems happy with the results as the stock is up 13.1% since reporting. It currently trades at $130.
Is now the time to buy Hamilton Lane? Access our full analysis of the earnings results here, it’s free for active Edge members.
Weakest Q3: P10 (NYSE: PX)
Operating as a bridge between institutional investors and hard-to-access private market opportunities, P10 (NYSE: PX) is an alternative asset management firm that provides access to private equity, venture capital, impact investing, and private credit opportunities in the middle and lower middle markets.
P10 reported revenues of $75.93 million, up 2.3% year on year, falling short of analysts’ expectations by 4.5%. It was a slower quarter as it posted a significant miss of analysts’ EBITDA and management fees estimates.
P10 delivered the weakest performance against analyst estimates in the group. As expected, the stock is down 1.5% since the results and currently trades at $10.42.
Read our full analysis of P10’s results here.
BNY (NYSE: BK)
Tracing its roots back to 1784 when it was founded by Alexander Hamilton, BNY (NYSE: BK) is a global financial institution that provides asset servicing, wealth management, and investment services to institutions, corporations, and high-net-worth individuals.
BNY reported revenues of $5.07 billion, up 9.1% year on year. This number topped analysts’ expectations by 2.1%. It was a strong quarter as it also logged a beat of analysts’ EPS estimates and a decent beat of analysts’ revenue estimates.
The stock is up 1.8% since reporting and currently trades at $111.
Read our full, actionable report on BNY here, it’s free for active Edge members.
T. Rowe Price (NASDAQ: TROW)
Founded in 1937 by Thomas Rowe Price Jr., who pioneered the growth stock investing approach, T. Rowe Price (NASDAQ: TROW) is an investment management firm that offers mutual funds, advisory services, and retirement planning solutions to individuals and institutions.
T. Rowe Price reported revenues of $1.91 billion, up 6.9% year on year. This print surpassed analysts’ expectations by 2.2%. Overall, it was a very strong quarter as it also recorded a beat of analysts’ EPS estimates and a solid beat of analysts’ EBITDA estimates.
The stock is flat since reporting and currently trades at $103.01.
Read our full, actionable report on T. Rowe Price here, it’s free for active Edge members.
Market Update
Thanks to the Fed’s rate hikes in 2022 and 2023, inflation has been on a steady path downward, easing back toward that 2% sweet spot. Fortunately (miraculously to some), all this tightening didn’t send the economy tumbling into a recession, so here we are, cautiously celebrating a soft landing. The cherry on top? Recent rate cuts (half a point in September 2024, a quarter in November) have propped up markets, especially after Trump’s November win lit a fire under major indices and sent them to all-time highs. However, there’s still plenty to ponder — tariffs, corporate tax cuts, and what 2025 might hold for the economy.
Want to invest in winners with rock-solid fundamentals? Check out our Top 6 Stocks and add them to your watchlist. These companies are poised for growth regardless of the political or macroeconomic climate.
StockStory is growing and hiring equity analyst and marketing roles. Are you a 0 to 1 builder passionate about the markets and AI? See the open roles here.