The past six months have been a windfall for Vicor’s shareholders. The company’s stock price has jumped 114%, hitting $94.03 per share. This was partly thanks to its solid quarterly results, and the performance may have investors wondering how to approach the situation.
Is there a buying opportunity in Vicor, or does it present a risk to your portfolio? Get the full breakdown from our expert analysts, it’s free for active Edge members.
Why Is Vicor Not Exciting?
We’re glad investors have benefited from the price increase, but we're swiping left on Vicor for now. Here are three reasons why VICR doesn't excite us and a stock we'd rather own.
1. Weak Backlog Growth Points to Soft Demand
Investors interested in Electronic Components companies should track backlog in addition to reported revenue. This metric shows the value of outstanding orders that have not yet been executed or delivered, giving visibility into Vicor’s future revenue streams.
Vicor’s backlog came in at $152.8 million in the latest quarter, and over the last two years, its year-on-year growth averaged 1.2%. This performance was underwhelming and suggests that increasing competition is causing challenges in winning new orders. 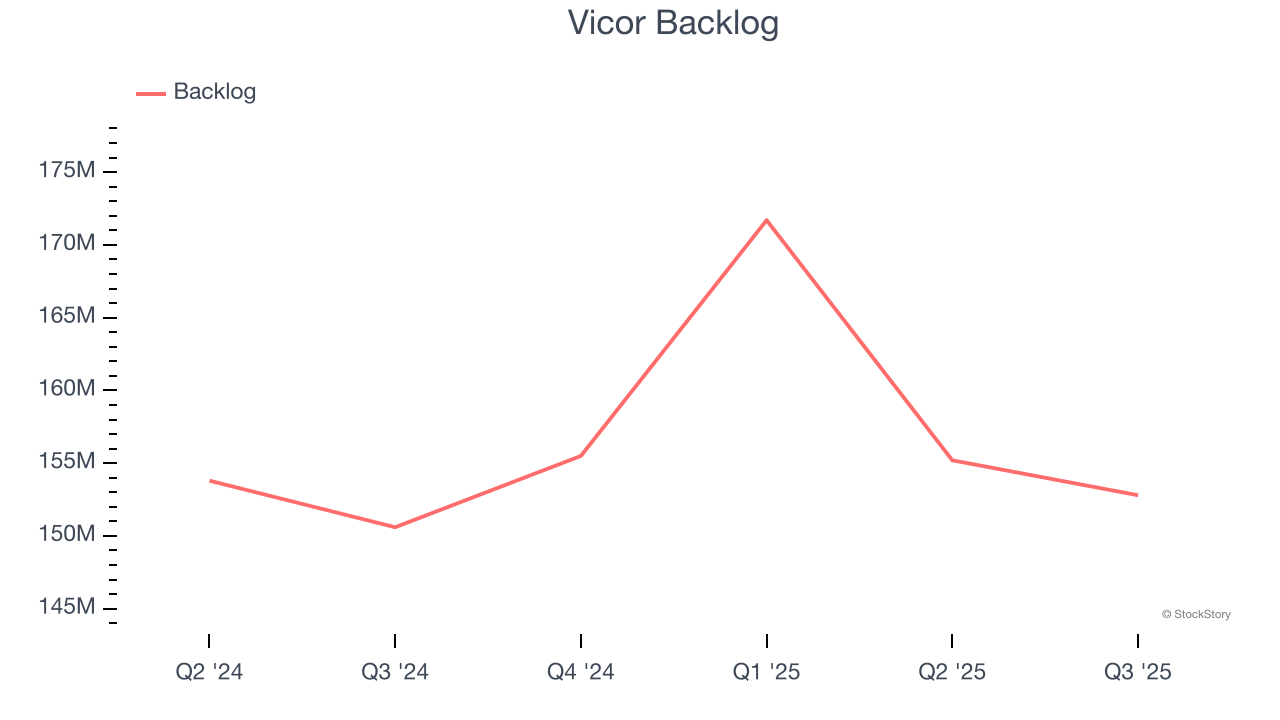
2. Shrinking Operating Margin
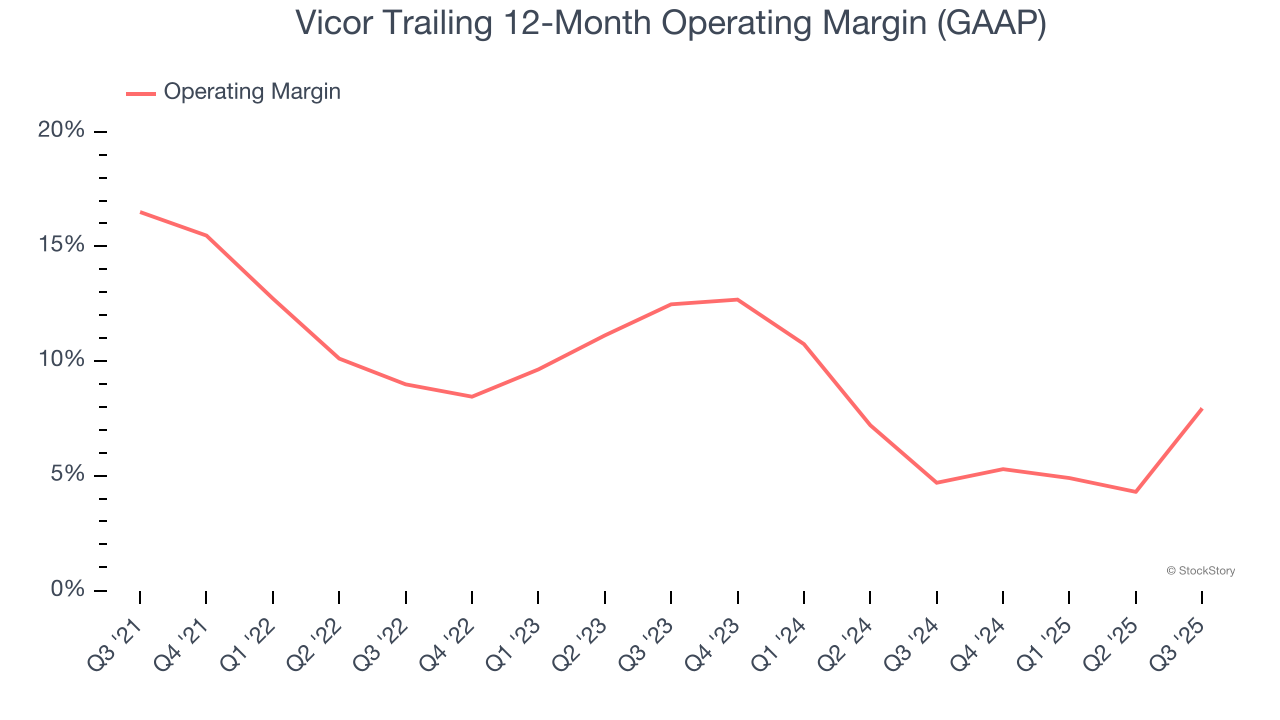
Operating margin is one of the best measures of profitability because it tells us how much money a company takes home after procuring and manufacturing its products, marketing and selling those products, and most importantly, keeping them relevant through research and development.
Looking at the trend in its profitability, Vicor’s operating margin decreased by 8.6 percentage points over the last five years. This raises questions about the company’s expense base because its revenue growth should have given it leverage on its fixed costs, resulting in better economies of scale and profitability. Its operating margin for the trailing 12 months was 7.9%.
3. New Investments Fail to Bear Fruit as ROIC Declines
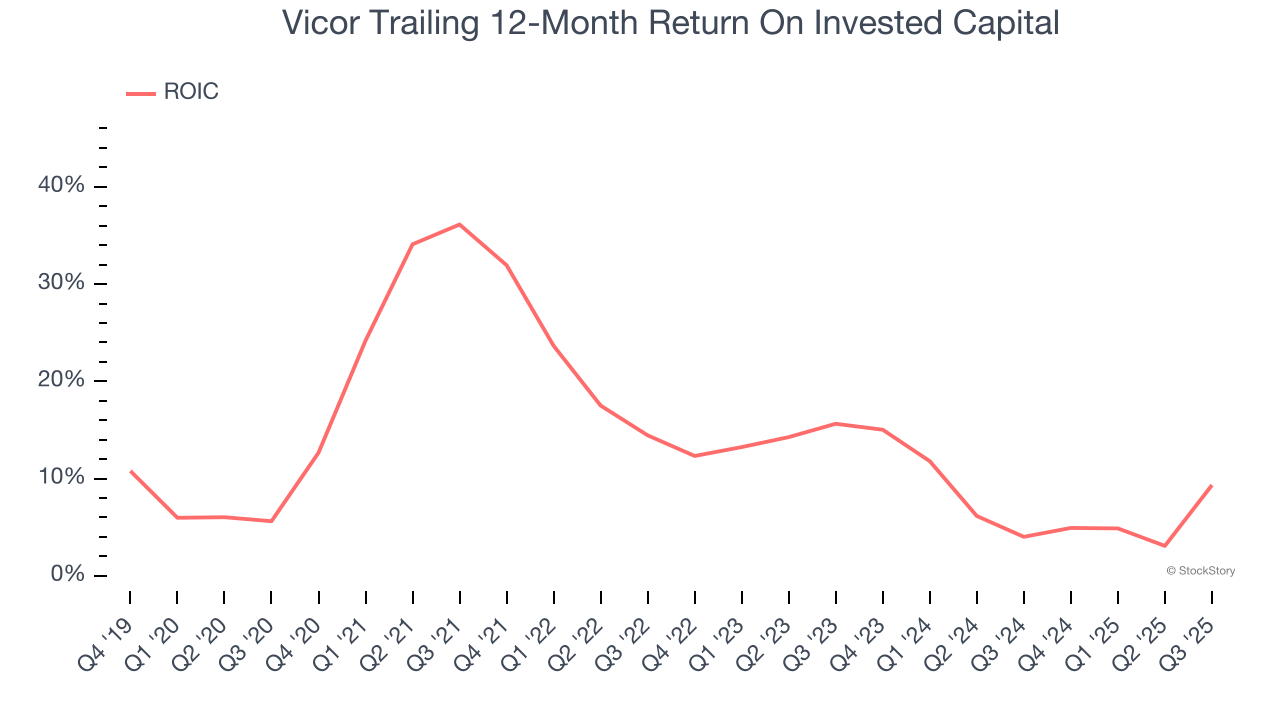
A company’s ROIC, or return on invested capital, shows how much operating profit it makes compared to the money it has raised (debt and equity).
We like to invest in businesses with high returns, but the trend in a company’s ROIC is what often surprises the market and moves the stock price. Over the last few years, Vicor’s ROIC has unfortunately decreased significantly. We like what management has done in the past, but its declining returns are perhaps a symptom of fewer profitable growth opportunities.
Final Judgment
Vicor isn’t a terrible business, but it doesn’t pass our quality test. After the recent surge, the stock trades at 45.2× forward P/E (or $94.03 per share). At this valuation, there’s a lot of good news priced in - we think other companies feature superior fundamentals at the moment. We’d recommend looking at a fast-growing restaurant franchise with an A+ ranch dressing sauce.
Stocks We Like More Than Vicor
Trump’s April 2025 tariff bombshell triggered a massive market selloff, but stocks have since staged an impressive recovery, leaving those who panic sold on the sidelines.
Take advantage of the rebound by checking out our Top 9 Market-Beating Stocks. This is a curated list of our High Quality stocks that have generated a market-beating return of 183% over the last five years (as of March 31st 2025).
Stocks that made our list in 2020 include now familiar names such as Nvidia (+1,545% between March 2020 and March 2025) as well as under-the-radar businesses like the once-small-cap company Comfort Systems (+782% five-year return). Find your next big winner with StockStory today.
StockStory is growing and hiring equity analyst and marketing roles. Are you a 0 to 1 builder passionate about the markets and AI? See the open roles here.