Customers Bancorp currently trades at $67.53 and has been a dream stock for shareholders. It’s returned 325% since November 2020, more than tripling the S&P 500’s 93.4% gain. The company has also beaten the index over the past six months as its stock price is up 24.6% thanks to its solid quarterly results.
Is now still a good time to buy CUBI? Or are investors being too optimistic? Find out in our full research report, it’s free for active Edge members.
Why Are We Positive On Customers Bancorp?
Originally founded with a "high-tech, high-touch" branch-light banking strategy, Customers Bancorp (NYSE: CUBI) is a bank holding company that provides commercial and consumer banking services through its Customers Bank subsidiary, with a focus on business lending and digital banking.
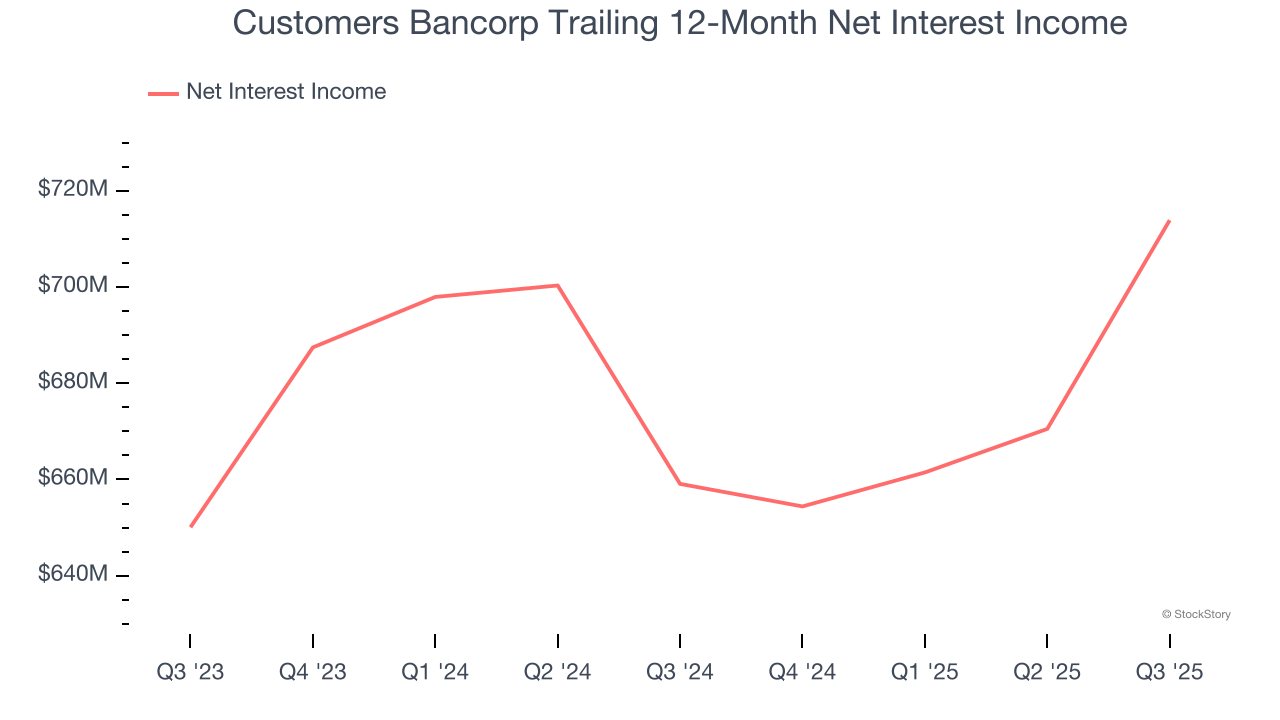
1. Net Interest Income Skyrockets, Fueling Growth Opportunities
Net interest income commands greater market attention due to its reliability and consistency, whereas one-time fees are often seen as lower-quality revenue that lacks the same dependable characteristics.
Customers Bancorp’s net interest income has grown at a 14.2% annualized rate over the last five years, better than the broader banking industry and in line with its total revenue. Its growth was driven by both an increase in its outstanding loans and net interest margin, which represents how much a bank earns in relation to its outstanding loan book.
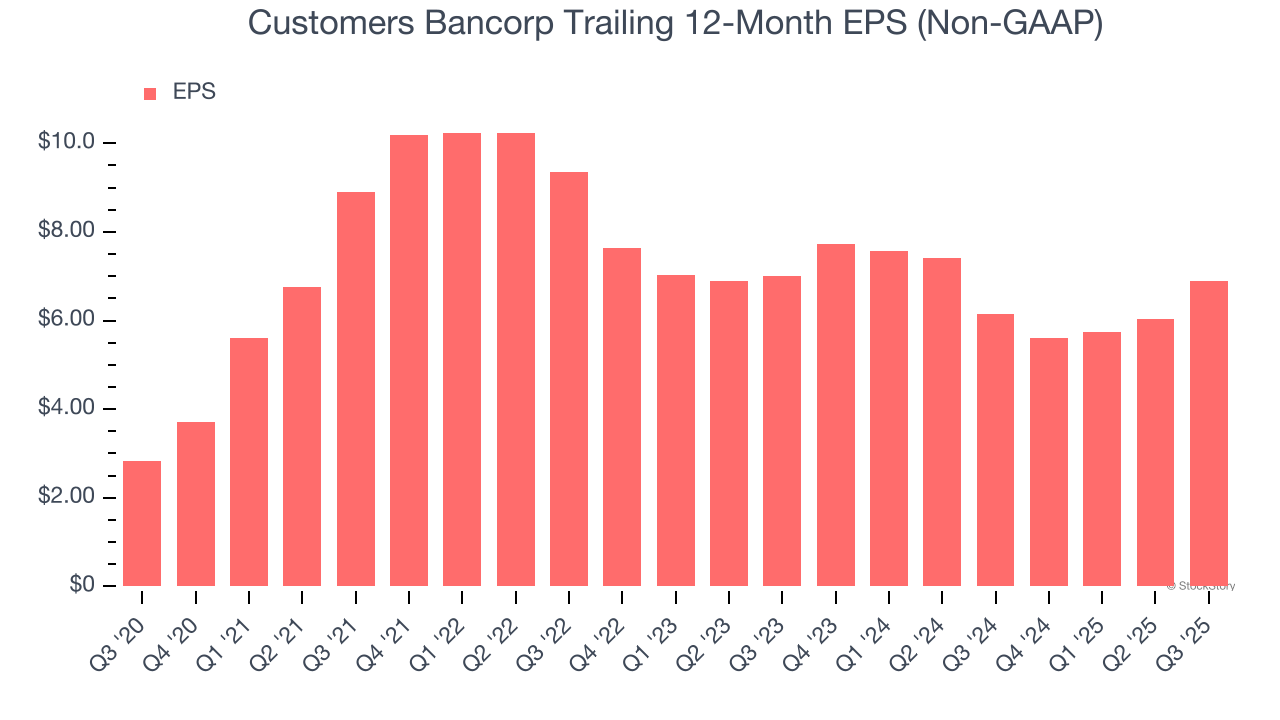
2. Outstanding Long-Term EPS Growth
Analyzing the long-term change in earnings per share (EPS) shows whether a company's incremental sales were profitable – for example, revenue could be inflated through excessive spending on advertising and promotions.
Customers Bancorp’s EPS grew at an astounding 19.5% compounded annual growth rate over the last five years, higher than its 14.5% annualized revenue growth. This tells us the company became more profitable on a per-share basis as it expanded.
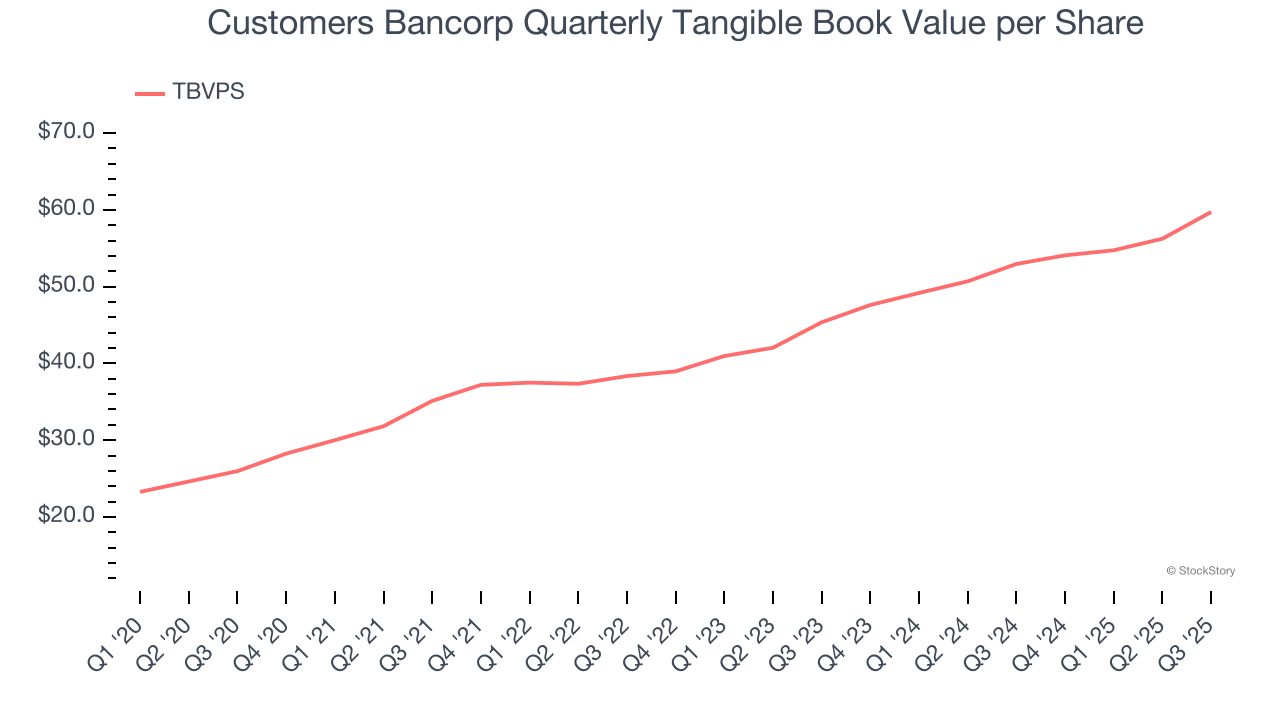
3. Growing TBVPS Reflects Strong Asset Base
We consider tangible book value per share (TBVPS) the most important metric to track for banks. TBVPS represents the real, liquid net worth per share of a bank, excluding intangible assets that have debatable value upon liquidation.
Customers Bancorp’s TBVPS increased by 18.1% annually over the last five years, and although its annualized growth has recently decelerated to 14.7% over the last two years (from $45.36 to $59.72 per share), we still think its performance was impressive.
Final Judgment
These are just a few reasons why we think Customers Bancorp is a great business, and with its shares beating the market recently, the stock trades at 1.1× forward P/B (or $67.53 per share). Is now the right time to buy? See for yourself in our full research report, it’s free for active Edge members.
High-Quality Stocks for All Market Conditions
Fresh US-China trade tensions just tanked stocks—but strong bank earnings are fueling a sharp rebound. Don’t miss the bounce.
Don’t let fear keep you from great opportunities and take a look at Top 9 Market-Beating Stocks. This is a curated list of our High Quality stocks that have generated a market-beating return of 183% over the last five years (as of March 31st 2025).
Stocks that made our list in 2020 include now familiar names such as Nvidia (+1,545% between March 2020 and March 2025) as well as under-the-radar businesses like the once-small-cap company Exlservice (+354% five-year return). Find your next big winner with StockStory today.
StockStory is growing and hiring equity analyst and marketing roles. Are you a 0 to 1 builder passionate about the markets and AI? See the open roles here.