Cash-back rewards platform Ibotta (NYSE: IBTA) reported revenue ahead of Wall Streets expectations in Q3 CY2025, but sales fell by 15.6% year on year to $83.26 million. On the other hand, next quarter’s revenue guidance of $82.5 million was less impressive, coming in 1.9% below analysts’ estimates. Its GAAP profit of $0.05 per share was significantly above analysts’ consensus estimates.
Is now the time to buy Ibotta? Find out by accessing our full research report, it’s free for active Edge members.
Ibotta (IBTA) Q3 CY2025 Highlights:
- Revenue: $83.26 million vs analyst estimates of $81.91 million (15.6% year-on-year decline, 1.6% beat)
- EPS (GAAP): $0.05 vs analyst estimates of $0 (significant beat)
- Adjusted EBITDA: $16.61 million vs analyst estimates of $12.2 million (20% margin, 36.2% beat)
- Revenue Guidance for Q4 CY2025 is $82.5 million at the midpoint, below analyst estimates of $84.14 million
- EBITDA guidance for Q4 CY2025 is $10.5 million at the midpoint, below analyst estimates of $11.46 million
- Operating Margin: 2.8%, down from 21% in the same quarter last year
- Free Cash Flow Margin: 12.7%, down from 37.2% in the same quarter last year
- Total Redemptions: 62.1 million, down 35.27 million year on year
- Market Capitalization: $882.9 million
Company Overview
Originally launched as a way to make grocery shopping more rewarding for budget-conscious consumers, Ibotta (NYSE: IBTA) is a mobile shopping app that allows consumers to earn cash back on everyday purchases by completing tasks and submitting receipts.
Revenue Growth
A company’s top-line performance can indicate its business quality. Rapid growth can signal it’s benefiting from an innovative new product or burgeoning market trend.
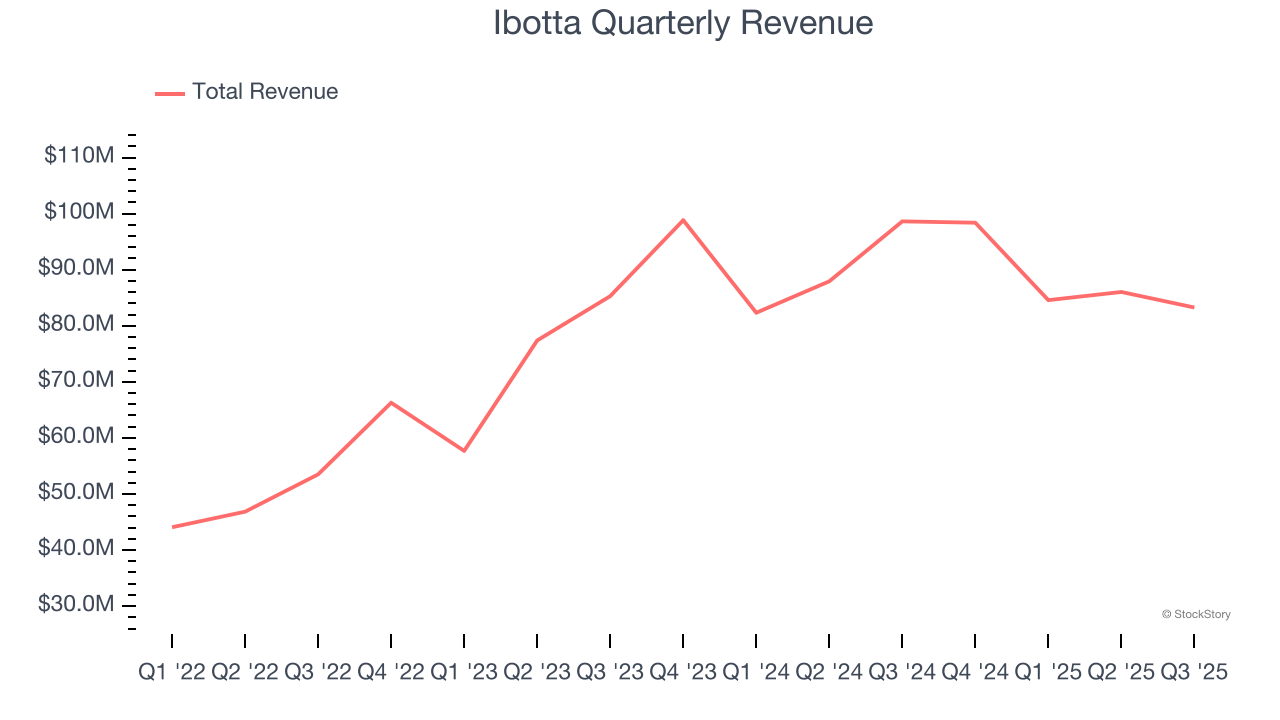
With $352.2 million in revenue over the past 12 months, Ibotta is a small player in the business services space, which sometimes brings disadvantages compared to larger competitors benefiting from economies of scale and numerous distribution channels.
Ibotta also discloses its number of total redemptions, which reached 62.1 million in the latest quarter. Over the last two years, Ibotta’s total redemptions averaged 30.1% year-on-year growth. Because this number is higher than its revenue growth during the same period, we can see the company’s monetization has fallen. 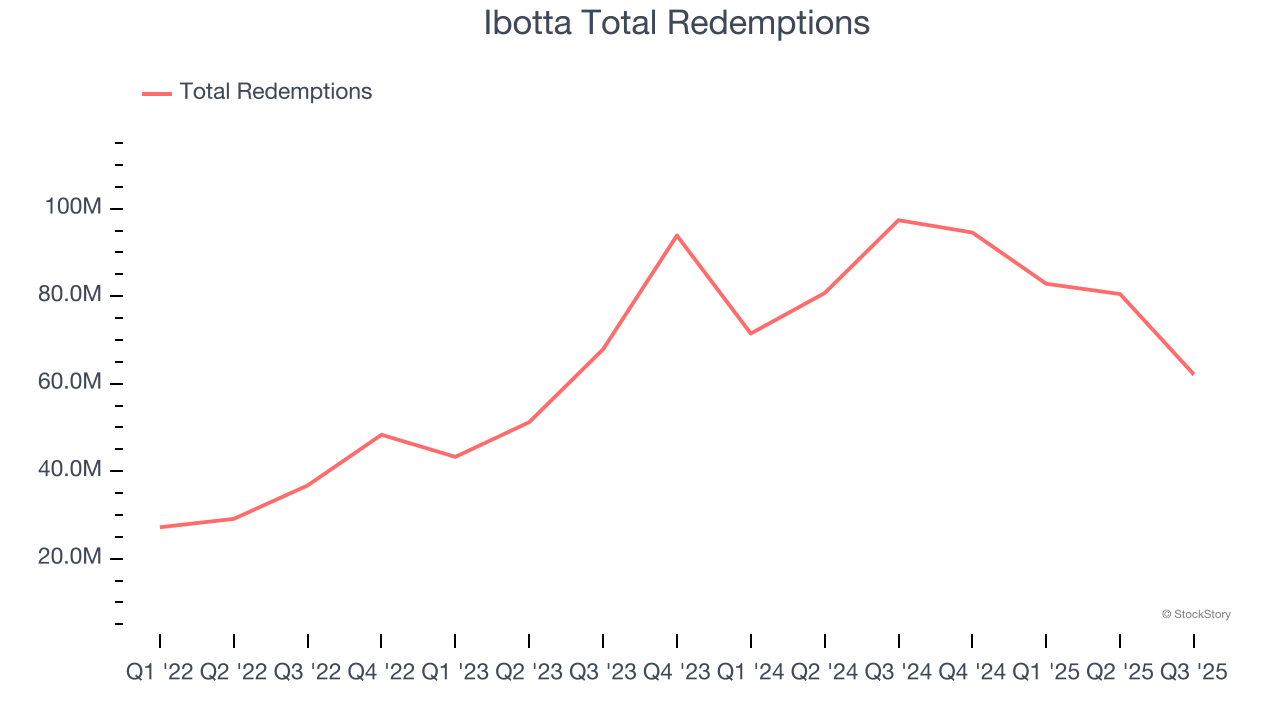
This quarter, Ibotta’s revenue fell by 15.6% year on year to $83.26 million but beat Wall Street’s estimates by 1.6%. Company management is currently guiding for a 16.1% year-on-year decline in sales next quarter.
Looking further ahead, sell-side analysts expect revenue to decline by 6.7% over the next 12 months, a deceleration versus the last two years. This projection doesn't excite us and suggests its products and services will see some demand headwinds.
The 1999 book Gorilla Game predicted Microsoft and Apple would dominate tech before it happened. Its thesis? Identify the platform winners early. Today, enterprise software companies embedding generative AI are becoming the new gorillas. a profitable, fast-growing enterprise software stock that is already riding the automation wave and looking to catch the generative AI next.
Operating Margin
Ibotta was profitable over the last four years but held back by its large cost base. Its average operating margin of 3.9% was weak for a business services business.
On the plus side, Ibotta’s operating margin rose by 30 percentage points over the last four years.
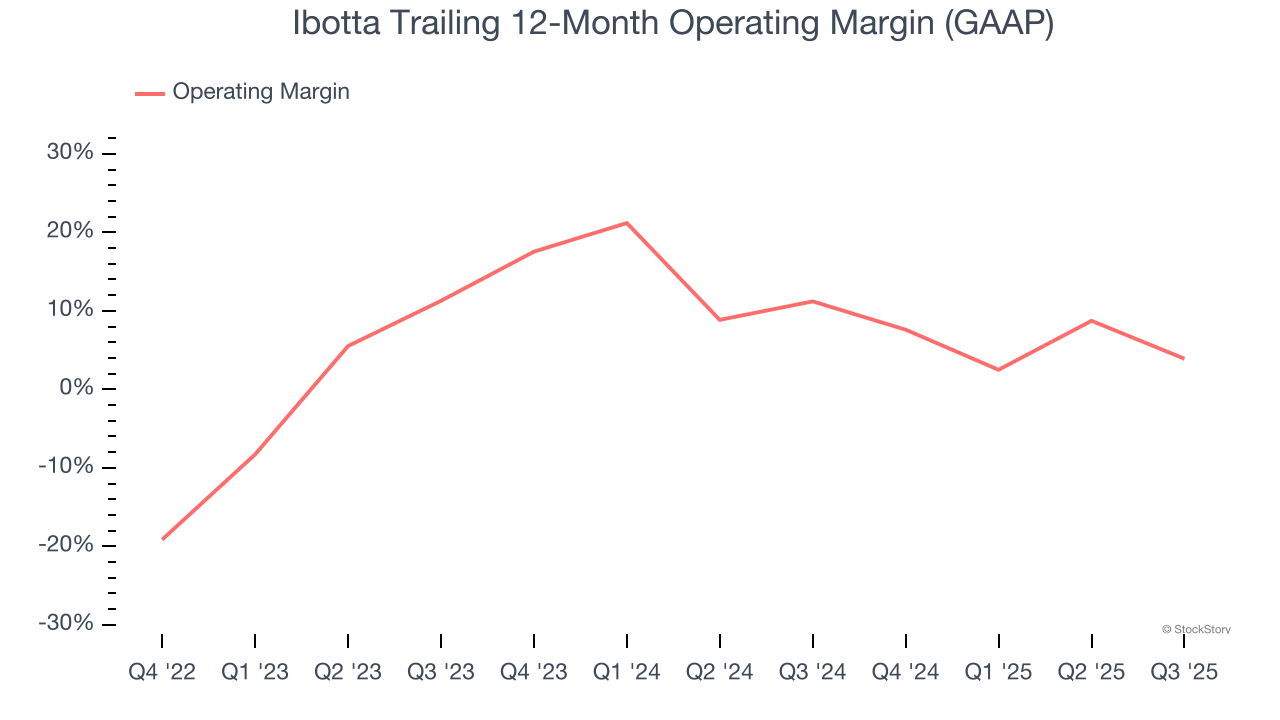
This quarter, Ibotta generated an operating margin profit margin of 2.8%, down 18.2 percentage points year on year. This contraction shows it was less efficient because its expenses increased relative to its revenue.
Cash Is King
Although earnings are undoubtedly valuable for assessing company performance, we believe cash is king because you can’t use accounting profits to pay the bills.
Ibotta has shown impressive cash profitability, giving it the option to reinvest or return capital to investors. The company’s free cash flow margin averaged 8.8% over the last four years, better than the broader business services sector. The divergence from its underwhelming operating margin stems from the add-back of non-cash charges like depreciation and stock-based compensation. GAAP operating profit expenses these line items, but free cash flow does not.
Taking a step back, we can see that Ibotta’s margin expanded by 48.6 percentage points during that time. This is encouraging, and we can see it became a less capital-intensive business because its free cash flow profitability rose more than its operating profitability.

Ibotta’s free cash flow clocked in at $10.59 million in Q3, equivalent to a 12.7% margin. The company’s cash profitability regressed as it was 24.5 percentage points lower than in the same quarter last year, but it’s still above its four-year average. We wouldn’t read too much into this quarter’s decline because investment needs can be seasonal, leading to short-term swings. Long-term trends carry greater meaning.
Key Takeaways from Ibotta’s Q3 Results
It was good to see Ibotta beat analysts’ EPS expectations this quarter. We were also happy its revenue outperformed Wall Street’s estimates. On the other hand, its revenue guidance for next quarter missed. Overall, this print had some key positives. The market seemed to be hoping for more, and the stock traded down 14% to $28.13 immediately after reporting.
Should you buy the stock or not? When making that decision, it’s important to consider its valuation, business qualities, as well as what has happened in the latest quarter. We cover that in our actionable full research report which you can read here, it’s free for active Edge members.