
Aerospace and defense company TransDigm (NYSE: TDG) reported Q3 CY2025 results topping the market’s revenue expectations, with sales up 11.5% year on year to $2.44 billion. On the other hand, the company’s full-year revenue guidance of $9.85 billion at the midpoint came in 1.1% below analysts’ estimates. Its non-GAAP profit of $10.82 per share was 7.6% above analysts’ consensus estimates.
Is now the time to buy TransDigm? Find out by accessing our full research report, it’s free for active Edge members.
TransDigm (TDG) Q3 CY2025 Highlights:
- Revenue: $2.44 billion vs analyst estimates of $2.4 billion (11.5% year-on-year growth, 1.6% beat)
- Adjusted EPS: $10.82 vs analyst estimates of $10.05 (7.6% beat)
- Adjusted EBITDA: $1.32 billion vs analyst estimates of $1.29 billion (54.2% margin, 2.3% beat)
- Adjusted EPS guidance for the upcoming financial year 2026 is $37.51 at the midpoint, missing analyst estimates by 7%
- EBITDA guidance for the upcoming financial year 2026 is $5.15 billion at the midpoint, below analyst estimates of $5.27 billion
- Operating Margin: 47.6%, up from 43.2% in the same quarter last year
- Organic Revenue rose 10.8% year on year vs analyst estimates of 8.7% growth (206.6 basis point beat)
- Market Capitalization: $72.92 billion
"We are pleased with our team's performance and operating results for both the fourth quarter and full fiscal year. Our strong fourth quarter finish resulted in surpassing the high end of our most recently issued fiscal 2025 revenue and EBITDA As Defined guidance," stated Mike Lisman, TransDigm Group's President and Chief Executive Officer.
Company Overview
Supplying parts for nearly all aircraft currently in service, TransDigm (NYSE: TDG) develops and manufactures components and systems for military and commercial aviation.
Revenue Growth
Reviewing a company’s long-term sales performance reveals insights into its quality. Even a bad business can shine for one or two quarters, but a top-tier one grows for years. Luckily, TransDigm’s sales grew at an impressive 11.6% compounded annual growth rate over the last five years. Its growth surpassed the average industrials company and shows its offerings resonate with customers, a great starting point for our analysis.
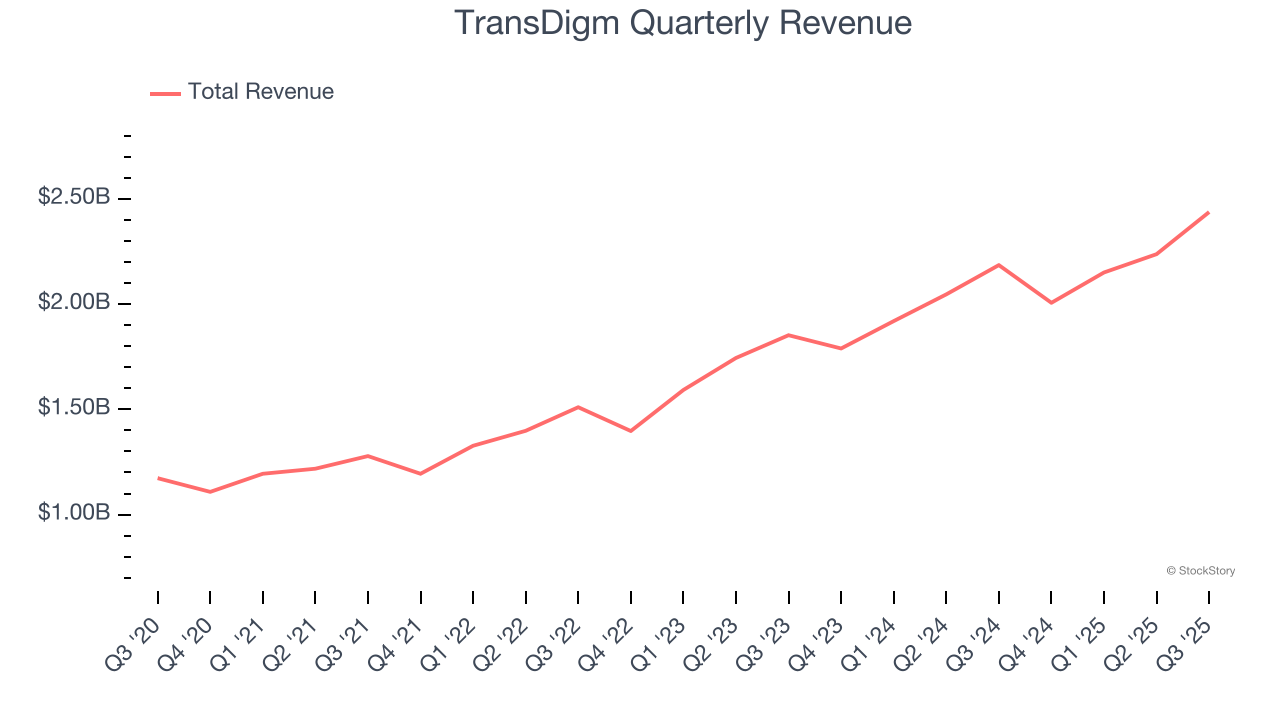
We at StockStory place the most emphasis on long-term growth, but within industrials, a half-decade historical view may miss cycles, industry trends, or a company capitalizing on catalysts such as a new contract win or a successful product line. TransDigm’s annualized revenue growth of 15.8% over the last two years is above its five-year trend, suggesting its demand was strong and recently accelerated. 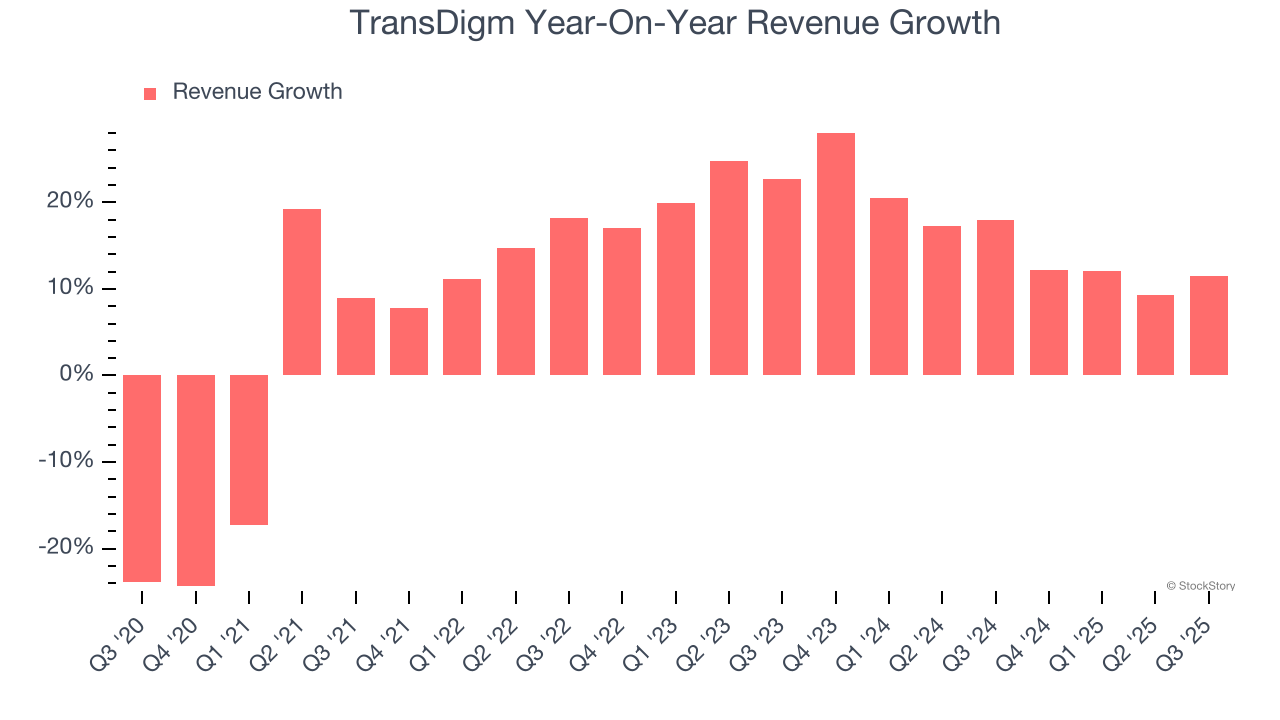
We can better understand the company’s sales dynamics by analyzing its organic revenue, which strips out one-time events like acquisitions and currency fluctuations that don’t accurately reflect its fundamentals. Over the last two years, TransDigm’s organic revenue averaged 12% year-on-year growth. Because this number is lower than its two-year revenue growth, we can see that some mixture of acquisitions and foreign exchange rates boosted its headline results. 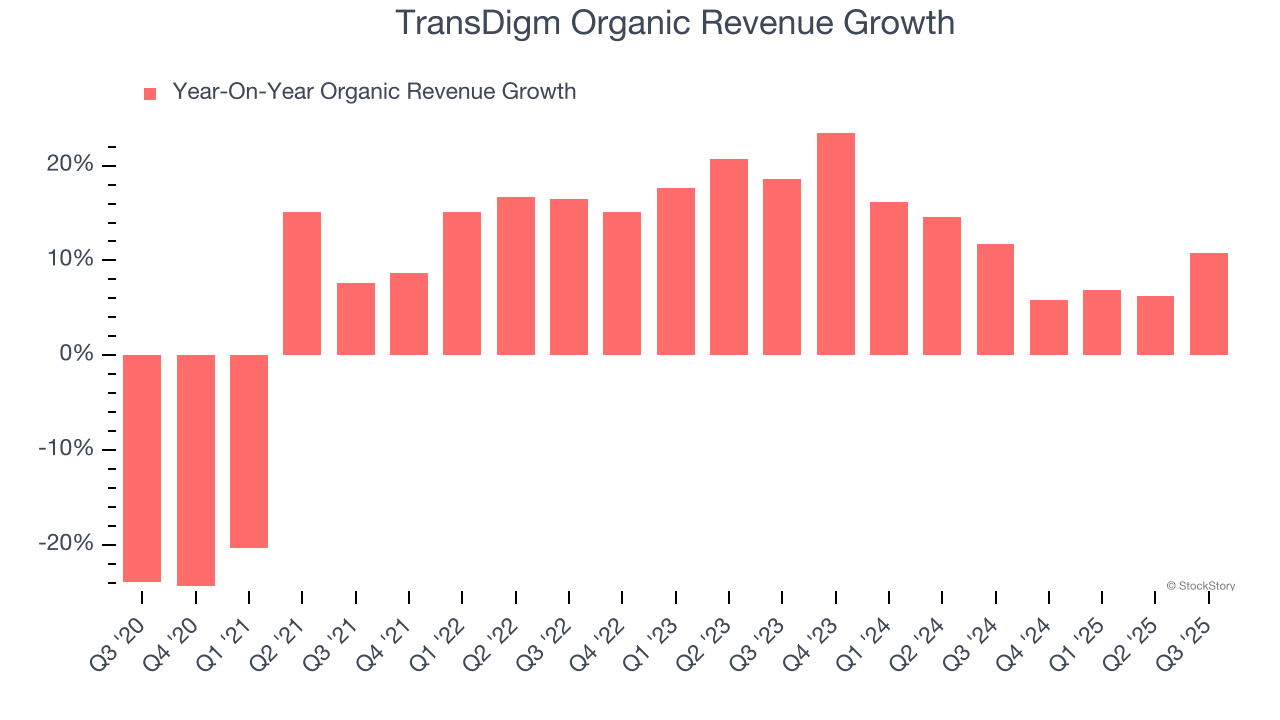
This quarter, TransDigm reported year-on-year revenue growth of 11.5%, and its $2.44 billion of revenue exceeded Wall Street’s estimates by 1.6%.
Looking ahead, sell-side analysts expect revenue to grow 11.4% over the next 12 months, a deceleration versus the last two years. Despite the slowdown, this projection is noteworthy and implies the market sees success for its products and services.
Microsoft, Alphabet, Coca-Cola, Monster Beverage—all began as under-the-radar growth stories riding a massive trend. We’ve identified the next one: a profitable AI semiconductor play Wall Street is still overlooking. Go here for access to our full report.
Operating Margin
TransDigm has been a well-oiled machine over the last five years. It demonstrated elite profitability for an industrials business, boasting an average operating margin of 43.3%.
Looking at the trend in its profitability, TransDigm’s operating margin rose by 11.9 percentage points over the last five years, as its sales growth gave it immense operating leverage.
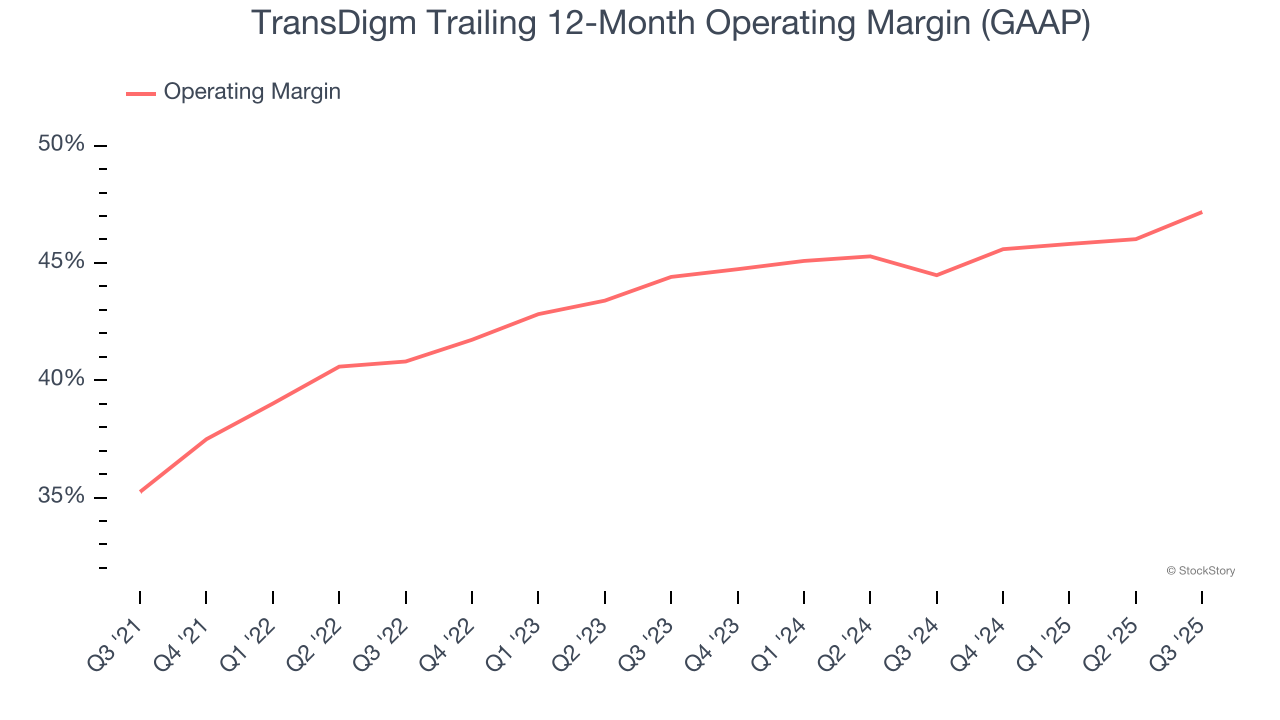
This quarter, TransDigm generated an operating margin profit margin of 47.6%, up 4.5 percentage points year on year. This increase was a welcome development and shows it was more efficient.
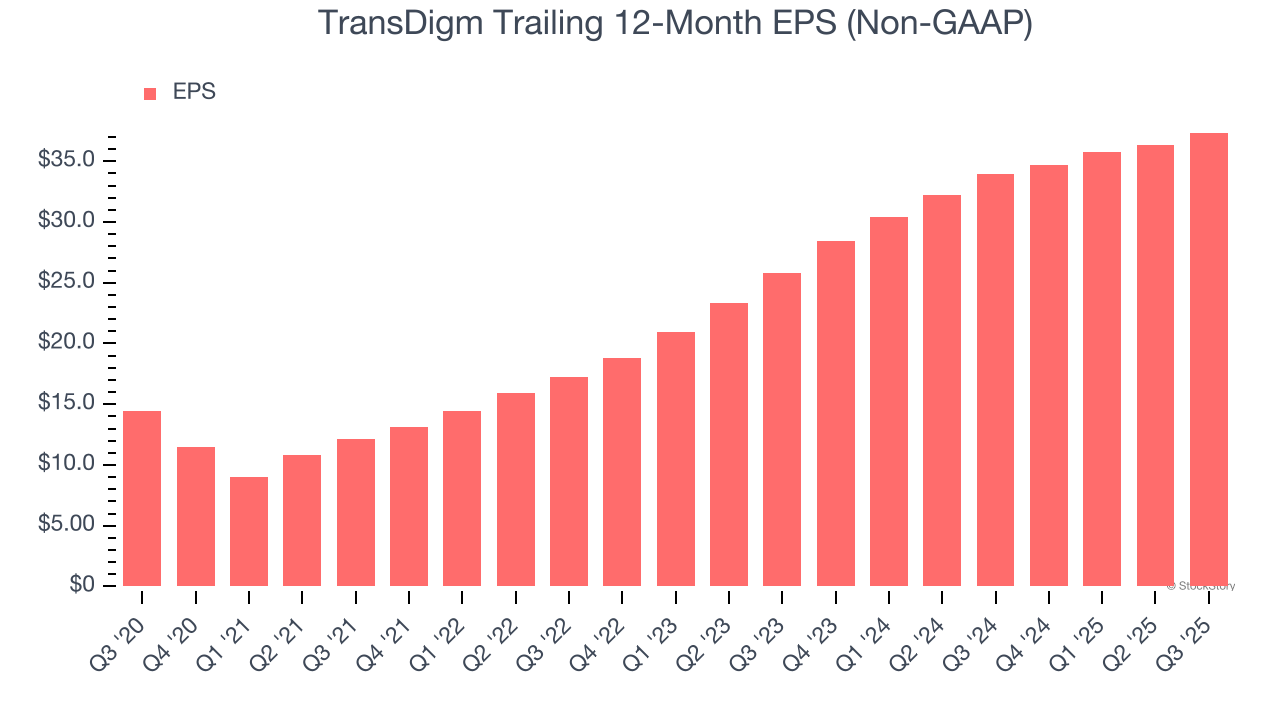
Earnings Per Share
We track the long-term change in earnings per share (EPS) for the same reason as long-term revenue growth. Compared to revenue, however, EPS highlights whether a company’s growth is profitable.
TransDigm’s EPS grew at an astounding 20.9% compounded annual growth rate over the last five years, higher than its 11.6% annualized revenue growth. This tells us the company became more profitable on a per-share basis as it expanded.
Diving into TransDigm’s quality of earnings can give us a better understanding of its performance. As we mentioned earlier, TransDigm’s operating margin expanded by 11.9 percentage points over the last five years. This was the most relevant factor (aside from the revenue impact) behind its higher earnings; interest expenses and taxes can also affect EPS but don’t tell us as much about a company’s fundamentals.
Like with revenue, we analyze EPS over a shorter period to see if we are missing a change in the business.
For TransDigm, its two-year annual EPS growth of 20.2% is similar to its five-year trend, implying strong and stable earnings power.
In Q3, TransDigm reported adjusted EPS of $10.82, up from $9.83 in the same quarter last year. This print beat analysts’ estimates by 7.6%. Over the next 12 months, Wall Street expects TransDigm’s full-year EPS of $37.36 to grow 8.6%.
Key Takeaways from TransDigm’s Q3 Results
We enjoyed seeing TransDigm beat analysts’ organic revenue expectations this quarter. We were also happy its revenue outperformed Wall Street’s estimates. On the other hand, its full-year revenue and EBITDA guidance both missed Wall Street’s estimates, and this is weighing on shares. The stock traded down 3.4% to $1,250 immediately after reporting.
So should you invest in TransDigm right now? What happened in the latest quarter matters, but not as much as longer-term business quality and valuation, when deciding whether to invest in this stock. We cover that in our actionable full research report which you can read here, it’s free for active Edge members.


