Boat and marine products retailer MarineMax (NYSE: HZO) reported revenue ahead of Wall Streets expectations in Q3 CY2025, but sales fell by 1.9% year on year to $552.2 million. Its non-GAAP loss of $0.04 per share was 65.5% above analysts’ consensus estimates.
Is now the time to buy MarineMax? Find out by accessing our full research report, it’s free for active Edge members.
MarineMax (HZO) Q3 CY2025 Highlights:
- Revenue: $552.2 million vs analyst estimates of $543.8 million (1.9% year-on-year decline, 1.5% beat)
- Adjusted EPS: -$0.04 vs analyst estimates of -$0.12 (65.5% beat)
- Adjusted EBITDA: $17.28 million vs analyst estimates of $19.66 million (3.1% margin, 12.1% miss)
- Adjusted EPS guidance for the upcoming financial year 2026 is $0.68 at the midpoint, missing analyst estimates by 64.4%
- EBITDA guidance for the upcoming financial year 2026 is $117.5 million at the midpoint, below analyst estimates of $154 million
- Operating Margin: 2.5%, down from 4.8% in the same quarter last year
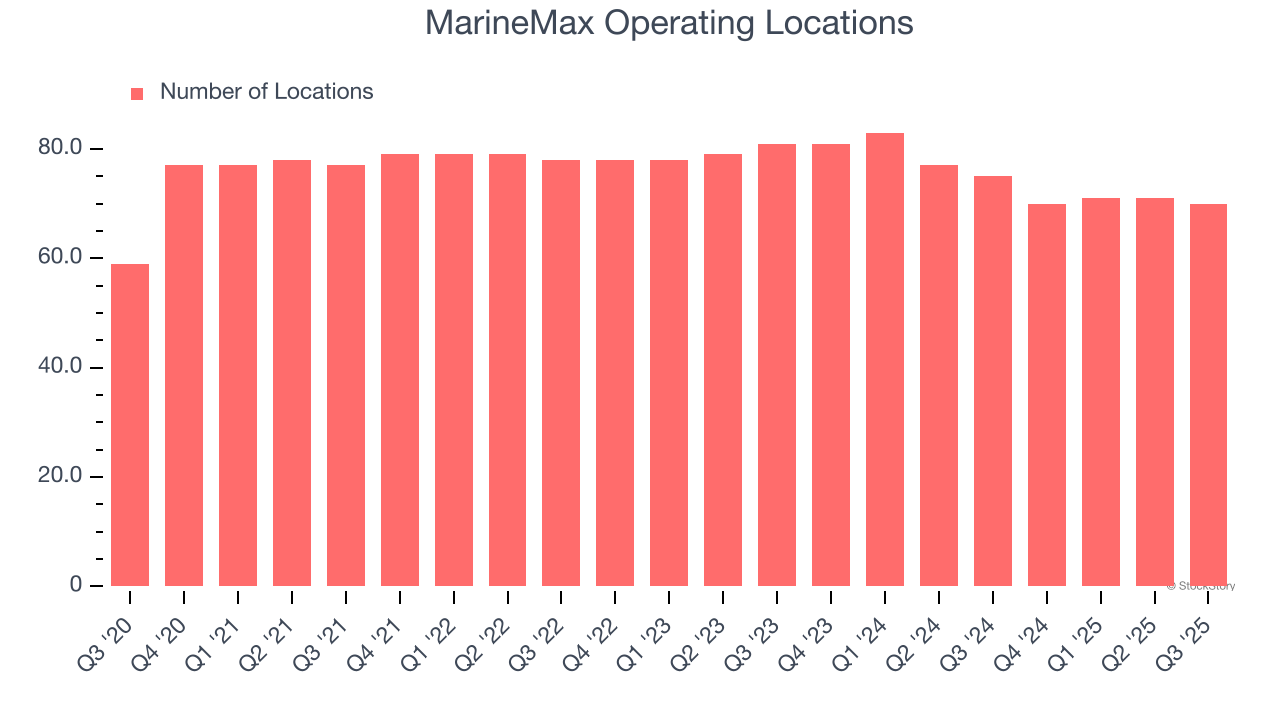
- Locations: 70 at quarter end, down from 75 in the same quarter last year
- Same-Store Sales rose 2.3% year on year (-3.3% in the same quarter last year)
- Market Capitalization: $504 million
“Our full year adjusted earnings and adjusted EBITDA were in line with our revised guidance, demonstrating the resilience of our diversified business model,” said Brett McGill, the Company’s Chief Executive Officer and President.
Company Overview
Appropriately headquartered in Clearwater, Florida, MarineMax (NYSE: HZO) sells boats, yachts, and other marine products.
Revenue Growth
A company’s long-term sales performance is one signal of its overall quality. Even a bad business can shine for one or two quarters, but a top-tier one grows for years.
With $2.31 billion in revenue over the past 12 months, MarineMax is a small retailer, which sometimes brings disadvantages compared to larger competitors benefiting from economies of scale and negotiating leverage with suppliers. On the bright side, it can grow faster because it has more white space to build new stores.
As you can see below, MarineMax grew its sales at a decent 11% compounded annual growth rate over the last six years (we compare to 2019 to normalize for COVID-19 impacts) despite closing stores.
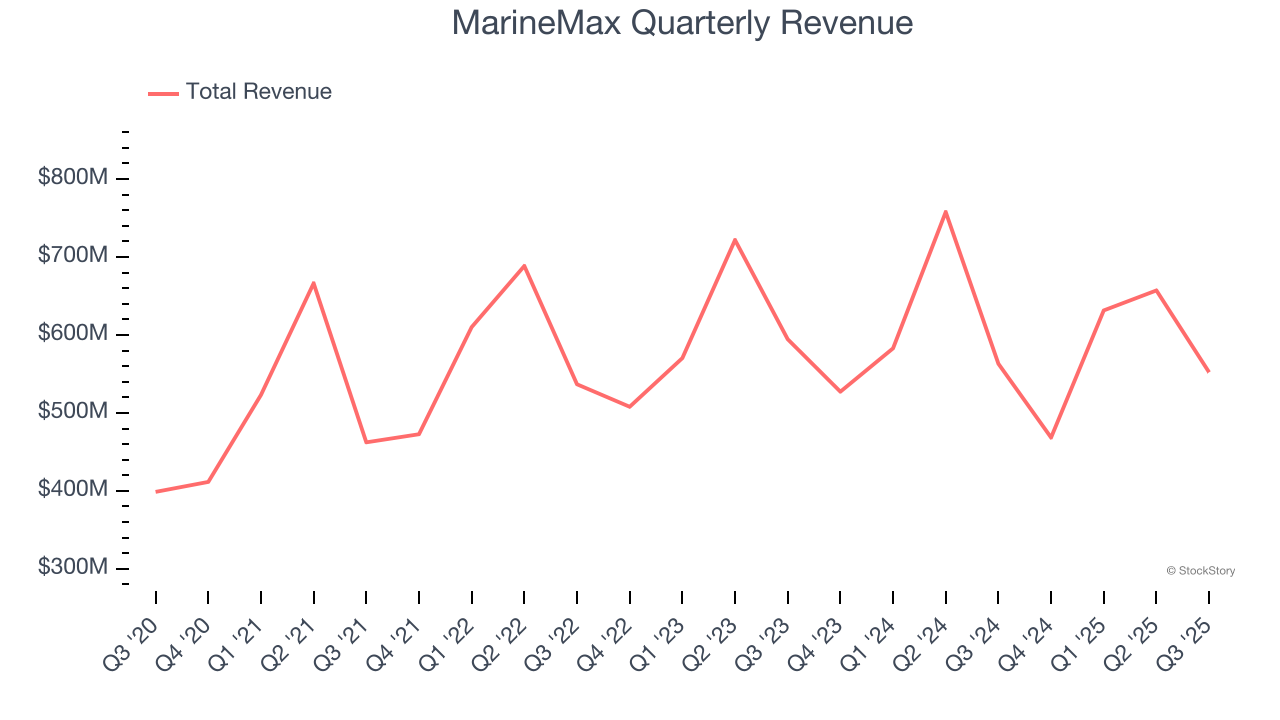
This quarter, MarineMax’s revenue fell by 1.9% year on year to $552.2 million but beat Wall Street’s estimates by 1.5%.
Looking ahead, sell-side analysts expect revenue to grow 5.4% over the next 12 months, a deceleration versus the last six years. Despite the slowdown, this projection is noteworthy and implies the market is forecasting success for its products.
While Wall Street chases Nvidia at all-time highs, an under-the-radar semiconductor supplier is dominating a critical AI component these giants can’t build without. Click here to access our free report one of our favorites growth stories.
Store Performance
Number of Stores
A retailer’s store count often determines how much revenue it can generate.
MarineMax listed 70 locations in the latest quarter and has generally closed its stores over the last two years, averaging 5.3% annual declines.
When a retailer shutters stores, it usually means that brick-and-mortar demand is less than supply, and it is responding by closing underperforming locations to improve profitability.
Same-Store Sales
A company's store base only paints one part of the picture. When demand is high, it makes sense to open more. But when demand is low, it’s prudent to close some locations and use the money in other ways. Same-store sales gives us insight into this topic because it measures organic growth for a retailer's e-commerce platform and brick-and-mortar shops that have existed for at least a year.
MarineMax’s demand within its existing locations has barely increased over the last two years as its same-store sales were flat. This performance isn’t ideal, and MarineMax is attempting to boost same-store sales by closing stores (fewer locations sometimes lead to higher same-store sales).
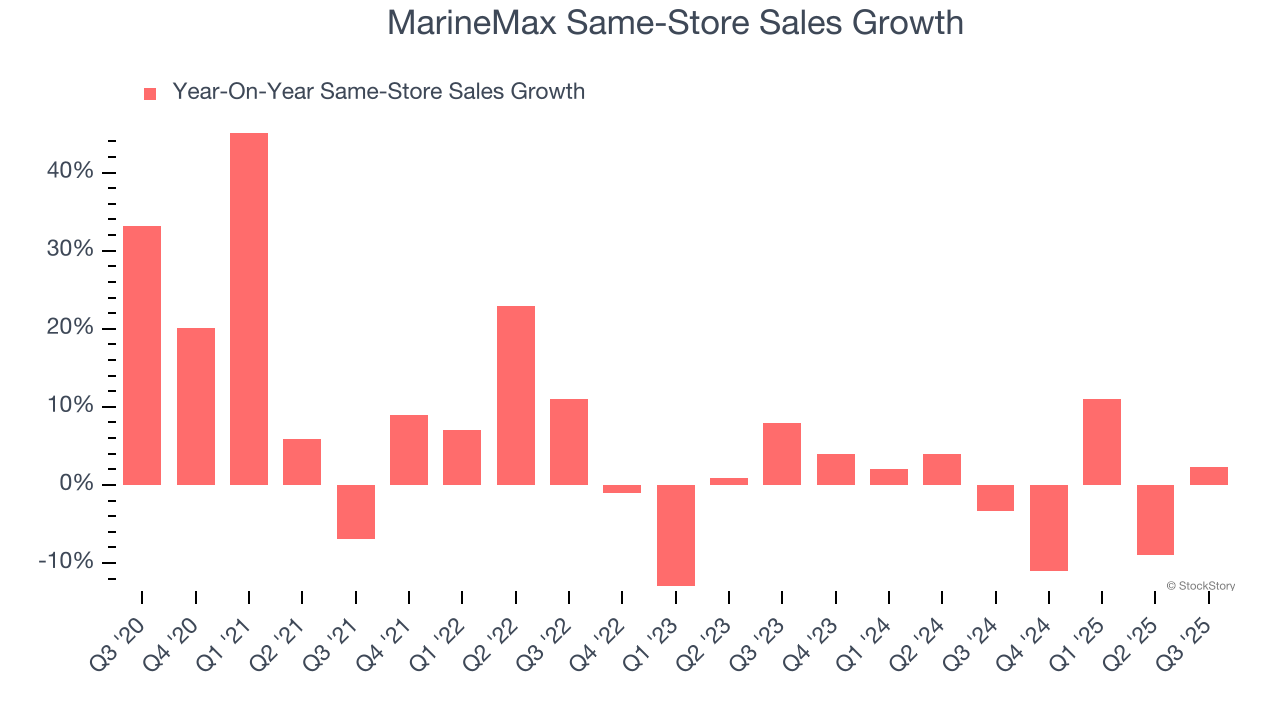
In the latest quarter, MarineMax’s same-store sales rose 2.3% year on year. This growth was a well-appreciated turnaround from its historical levels, showing the business is regaining momentum.
Key Takeaways from MarineMax’s Q3 Results
It was good to see MarineMax beat analysts’ EPS expectations this quarter. We were also excited its gross margin outperformed Wall Street’s estimates by a wide margin. On the other hand, its full-year EBITDA guidance missed and its EBITDA fell short of Wall Street’s estimates. Overall, this was a softer quarter. The stock traded down 8.8% to $21.44 immediately after reporting.
Is MarineMax an attractive investment opportunity at the current price? The latest quarter does matter, but not nearly as much as longer-term fundamentals and valuation, when deciding if the stock is a buy. We cover that in our actionable full research report which you can read here, it’s free for active Edge members.