
Shareholders of Paychex would probably like to forget the past six months even happened. The stock dropped 28.9% and now trades at $112.51. This was partly due to its softer quarterly results and might have investors contemplating their next move.
Is there a buying opportunity in Paychex, or does it present a risk to your portfolio? Check out our in-depth research report to see what our analysts have to say, it’s free for active Edge members.
Why Is Paychex Not Exciting?
Even with the cheaper entry price, we're swiping left on Paychex for now. Here are three reasons you should be careful with PAYX and a stock we'd rather own.
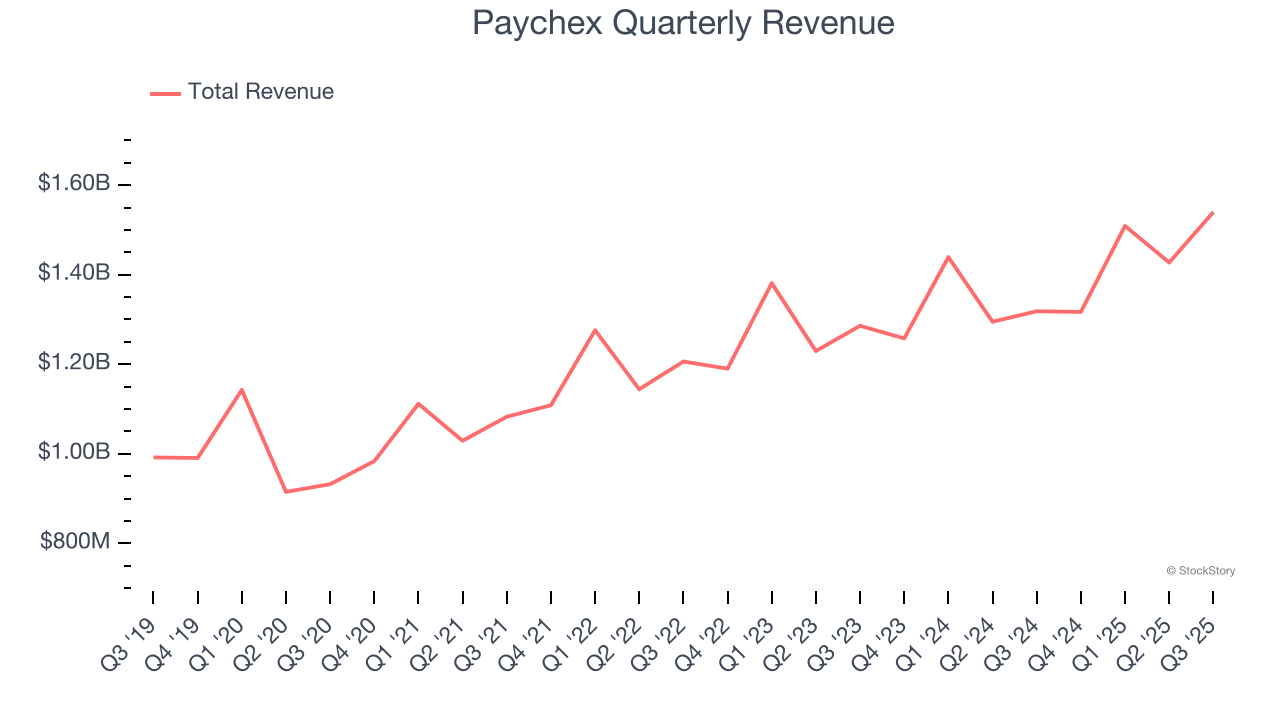
1. Long-Term Revenue Growth Disappoints
Examining a company’s long-term performance can provide clues about its quality. Any business can have short-term success, but a top-tier one grows for years. Regrettably, Paychex’s sales grew at a sluggish 7.8% compounded annual growth rate over the last five years. This fell short of our benchmark for the software sector.
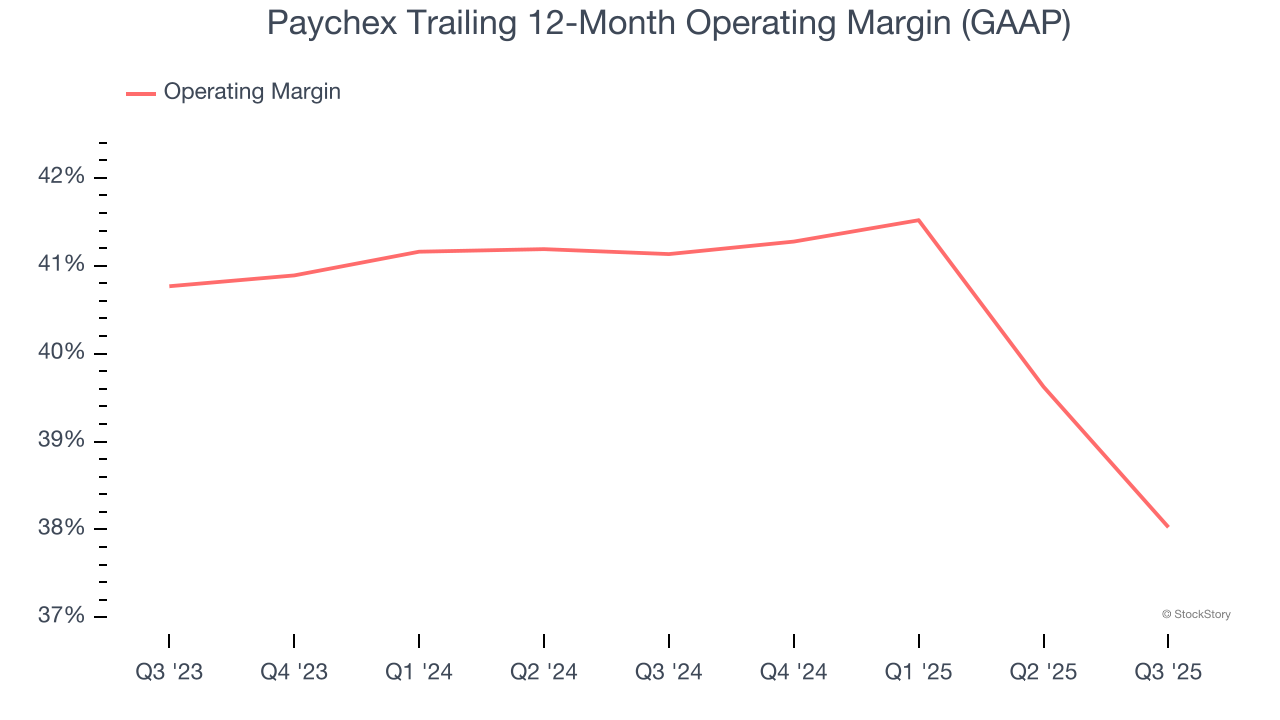
2. Shrinking Operating Margin
While many software businesses point investors to their adjusted profits, which exclude stock-based compensation (SBC), we prefer GAAP operating margin because SBC is a legitimate expense used to attract and retain talent. This metric shows how much revenue remains after accounting for all core expenses – everything from the cost of goods sold to sales and R&D.
Analyzing the trend in its profitability, Paychex’s operating margin decreased by 3.1 percentage points over the last two years. This raises questions about the company’s expense base because its revenue growth should have given it leverage on its fixed costs, resulting in better economies of scale and profitability. Its operating margin for the trailing 12 months was 38%.
3. Cash Flow Margin Set to Decline
If you’ve followed StockStory for a while, you know we emphasize free cash flow. Why, you ask? We believe that in the end, cash is king, and you can’t use accounting profits to pay the bills.
Over the next year, analysts predict Paychex’s cash conversion will fall. Their consensus estimates imply its free cash flow margin of 33% for the last 12 months will decrease to 30.3%.
Final Judgment
Paychex isn’t a terrible business, but it doesn’t pass our bar. After the recent drawdown, the stock trades at 6.1× forward price-to-sales (or $112.51 per share). While this valuation is fair, the upside isn’t great compared to the potential downside. We're fairly confident there are better investments elsewhere. We’d recommend looking at one of Charlie Munger’s all-time favorite businesses.
Stocks We Like More Than Paychex
The market’s up big this year - but there’s a catch. Just 4 stocks account for half the S&P 500’s entire gain. That kind of concentration makes investors nervous, and for good reason. While everyone piles into the same crowded names, smart investors are hunting quality where no one’s looking - and paying a fraction of the price. Check out the high-quality names we’ve flagged in our Top 5 Strong Momentum Stocks for this week. This is a curated list of our High Quality stocks that have generated a market-beating return of 244% over the last five years (as of June 30, 2025).
Stocks that have made our list include now familiar names such as Nvidia (+1,326% between June 2020 and June 2025) as well as under-the-radar businesses like the once-micro-cap company Kadant (+351% five-year return). Find your next big winner with StockStory today.
StockStory is growing and hiring equity analyst and marketing roles. Are you a 0 to 1 builder passionate about the markets and AI? See the open roles here.


