
Let’s dig into the relative performance of 3M (NYSE: MMM) and its peers as we unravel the now-completed Q3 general industrial machinery earnings season.
Automation that increases efficiency and connected equipment that collects analyzable data have been trending, creating new demand for general industrial machinery companies. Those who innovate and create digitized solutions can spur sales and speed up replacement cycles, but all general industrial machinery companies are still at the whim of economic cycles. Consumer spending and interest rates, for example, can greatly impact the industrial production that drives demand for these companies’ offerings.
The 14 general industrial machinery stocks we track reported a strong Q3. As a group, revenues beat analysts’ consensus estimates by 1.2% while next quarter’s revenue guidance was in line.
While some general industrial machinery stocks have fared somewhat better than others, they have collectively declined. On average, share prices are down 1.8% since the latest earnings results.
3M (NYSE: MMM)
Producers of the first asthma inhaler, 3M Company (NYSE: MMM) is a global conglomerate known for products in industries like healthcare, safety, electronics, and consumer goods.
3M reported revenues of $6.32 billion, flat year on year. This print exceeded analysts’ expectations by 1%. Overall, it was a strong quarter for the company with an impressive beat of analysts’ adjusted operating income estimates and a decent beat of analysts’ EBITDA estimates.
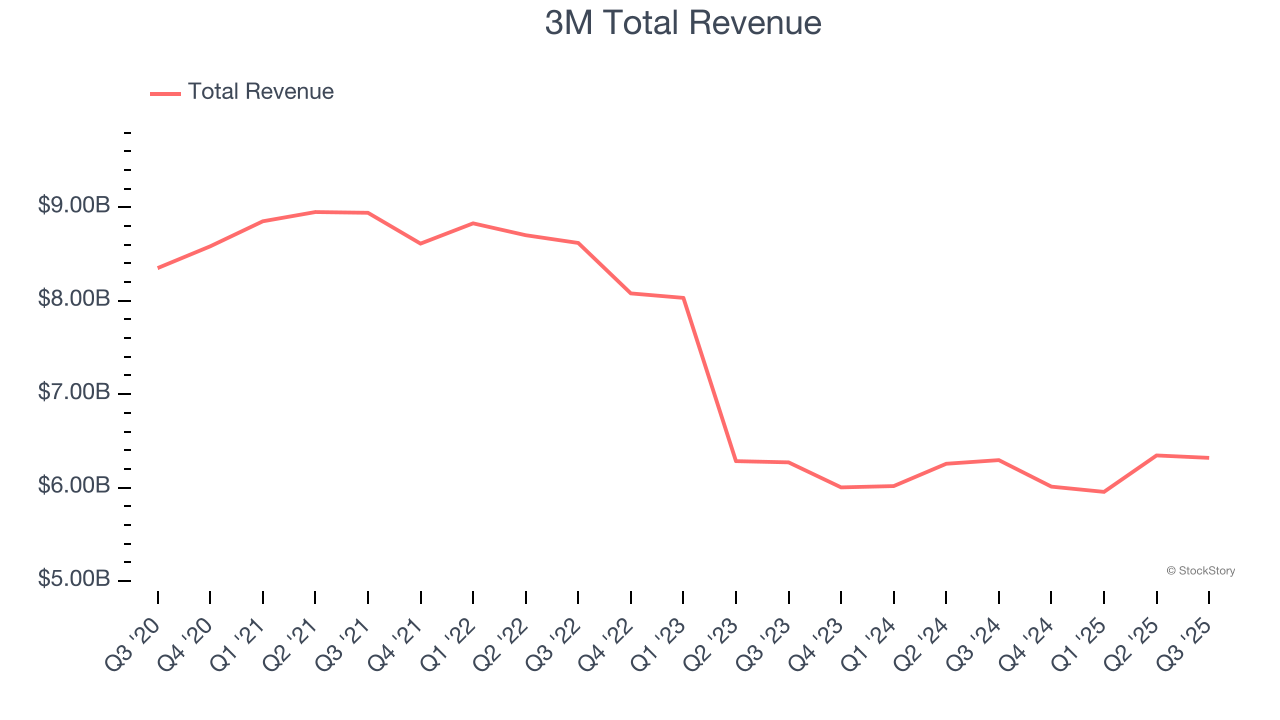
Interestingly, the stock is up 7.7% since reporting and currently trades at $168.06.
Is now the time to buy 3M? Access our full analysis of the earnings results here, it’s free for active Edge members.
Best Q3: Icahn Enterprises (NASDAQ: IEP)
Founded in 1987, Icahn Enterprises (NASDAQ: IEP) is a diversified holding company primarily engaged in investment and asset management across various sectors.
Icahn Enterprises reported revenues of $2.51 billion, down 9.9% year on year, outperforming analysts’ expectations by 4.3%. The business had an incredible quarter with a beat of analysts’ EPS estimates and a solid beat of analysts’ revenue estimates.
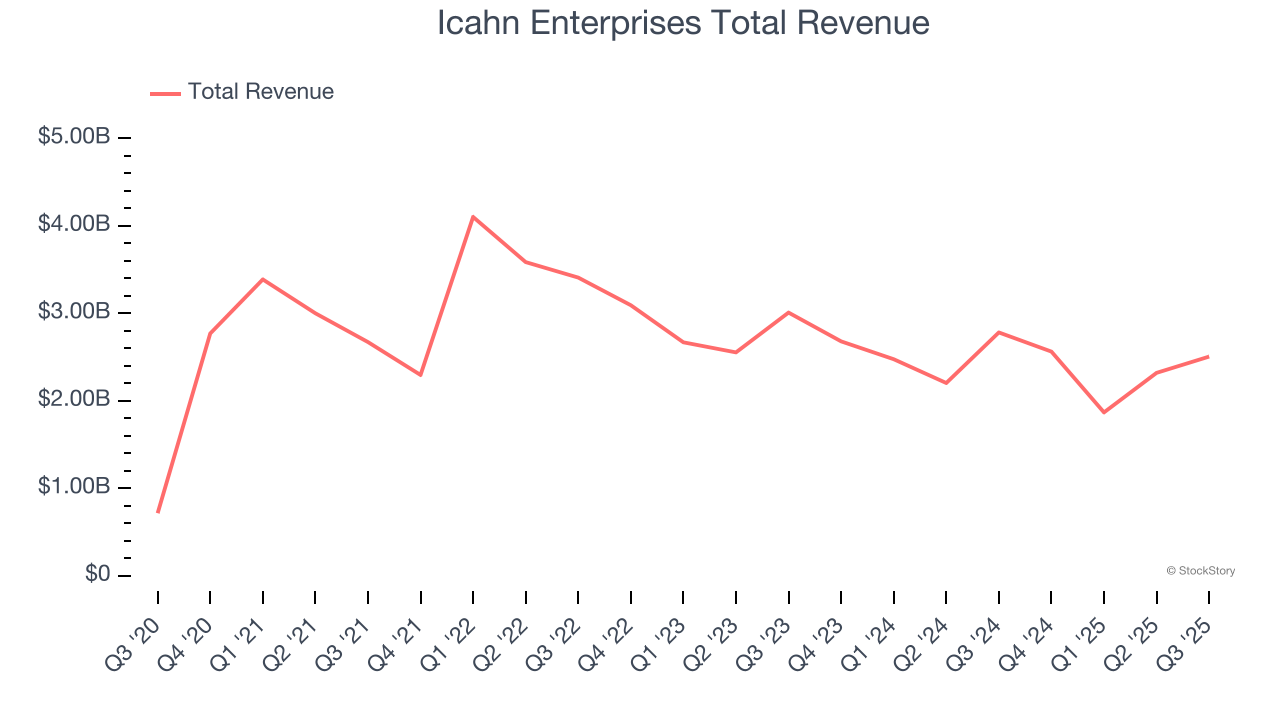
The market seems happy with the results as the stock is up 7.9% since reporting. It currently trades at $8.76.
Is now the time to buy Icahn Enterprises? Access our full analysis of the earnings results here, it’s free for active Edge members.
Weakest Q3: Albany (NYSE: AIN)
Founded in 1895, Albany (NYSE: AIN) is a global textiles and materials processing company, specializing in machine clothing for paper mills and engineered composite structures for aerospace and other industries.
Albany reported revenues of $261.4 million, down 12.4% year on year, falling short of analysts’ expectations by 12.8%. It was a disappointing quarter as it posted a miss of analysts’ Engineered Composites revenue estimates and a significant miss of analysts’ revenue estimates.
Albany delivered the weakest performance against analyst estimates and slowest revenue growth in the group. As expected, the stock is down 17.2% since the results and currently trades at $45.18.
Read our full analysis of Albany’s results here.
Kadant (NYSE: KAI)
Headquartered in Massachusetts, Kadant (NYSE: KAI) is a global supplier of high-value, critical components and engineered systems used in process industries worldwide.
Kadant reported revenues of $271.6 million, flat year on year. This number topped analysts’ expectations by 4.2%. Overall, it was a very strong quarter as it also produced an impressive beat of analysts’ EBITDA estimates and a solid beat of analysts’ adjusted operating income estimates.
Kadant had the weakest full-year guidance update among its peers. The stock is down 14.7% since reporting and currently trades at $255.10.
Read our full, actionable report on Kadant here, it’s free for active Edge members.
Dover (NYSE: DOV)
A company that manufactured critical equipment for the United States military during World War II, Dover (NYSE: DOV) manufactures engineered components and specialized equipment for numerous industries.
Dover reported revenues of $2.08 billion, up 4.8% year on year. This print came in 1% below analysts' expectations. Overall, it was a slower quarter as it also recorded a significant miss of analysts’ adjusted operating income estimates and a miss of analysts’ organic revenue estimates.
The stock is up 9.4% since reporting and currently trades at $183.44.
Read our full, actionable report on Dover here, it’s free for active Edge members.
Market Update
In response to the Fed’s rate hikes in 2022 and 2023, inflation has been gradually trending down from its post-pandemic peak, trending closer to the Fed’s 2% target. Despite higher borrowing costs, the economy has avoided flashing recessionary signals. This is the much-desired soft landing that many investors hoped for. The recent rate cuts (0.5% in September and 0.25% in November 2024) have bolstered the stock market, making 2024 a strong year for equities. Donald Trump’s presidential win in November sparked additional market gains, sending indices to record highs in the days following his victory. However, debates continue over possible tariffs and corporate tax adjustments, raising questions about economic stability in 2025.
Want to invest in winners with rock-solid fundamentals? Check out our 9 Best Market-Beating Stocks and add them to your watchlist. These companies are poised for growth regardless of the political or macroeconomic climate.
StockStory’s analyst team — all seasoned professional investors — uses quantitative analysis and automation to deliver market-beating insights faster and with higher quality.


