MSA Safety currently trades at $155.56 per share and has shown little upside over the past six months, posting a small loss of 2.4%. The stock also fell short of the S&P 500’s 13% gain during that period.
Is now the time to buy MSA Safety, or should you be careful about including it in your portfolio? Get the full stock story straight from our expert analysts, it’s free for active Edge members.
Why Is MSA Safety Not Exciting?
We're cautious about MSA Safety. Here are three reasons why MSA doesn't excite us and a stock we'd rather own.
1. Lackluster Revenue Growth
Long-term growth is the most important, but within business services, a stretched historical view may miss new innovations or demand cycles. MSA Safety’s recent performance shows its demand has slowed as its annualized revenue growth of 3.6% over the last two years was below its five-year trend. 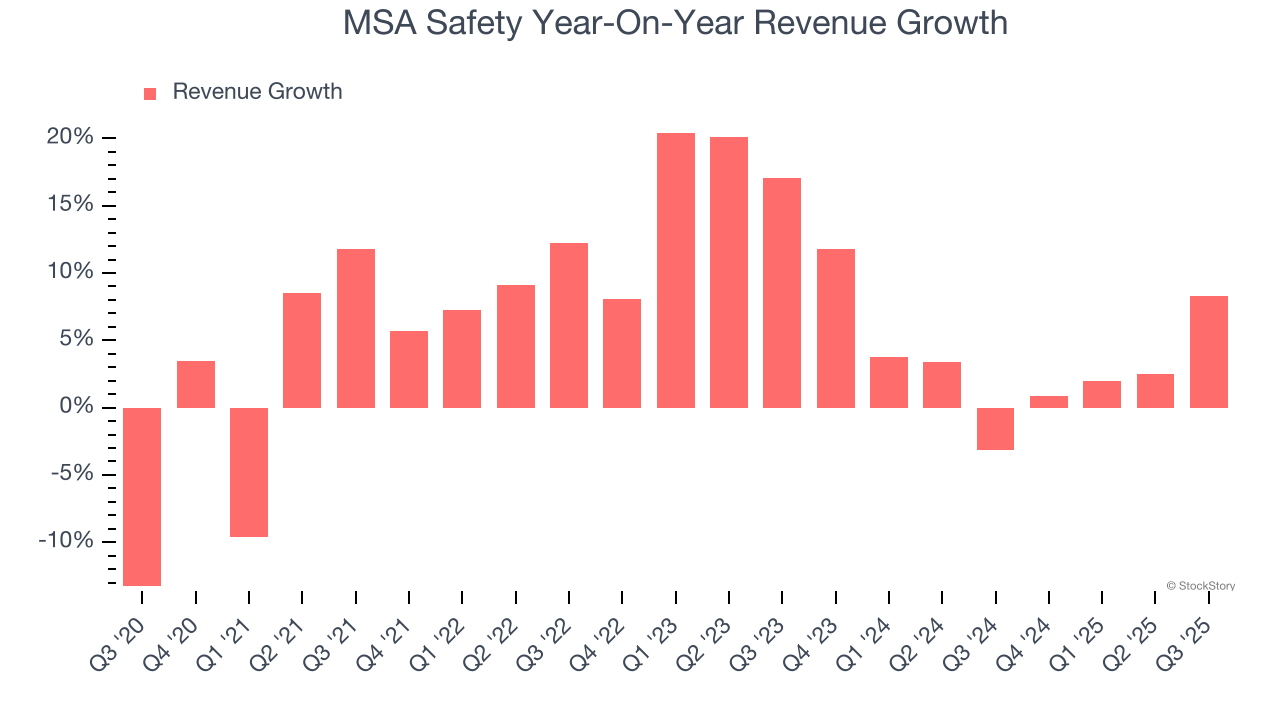
2. Fewer Distribution Channels than Larger Competitors
With $1.86 billion in revenue over the past 12 months, MSA Safety is a mid-sized business services company, which sometimes brings disadvantages compared to larger competitors benefiting from better economies of scale. On the bright side, it can still flex high growth rates because it’s working from a smaller revenue base.
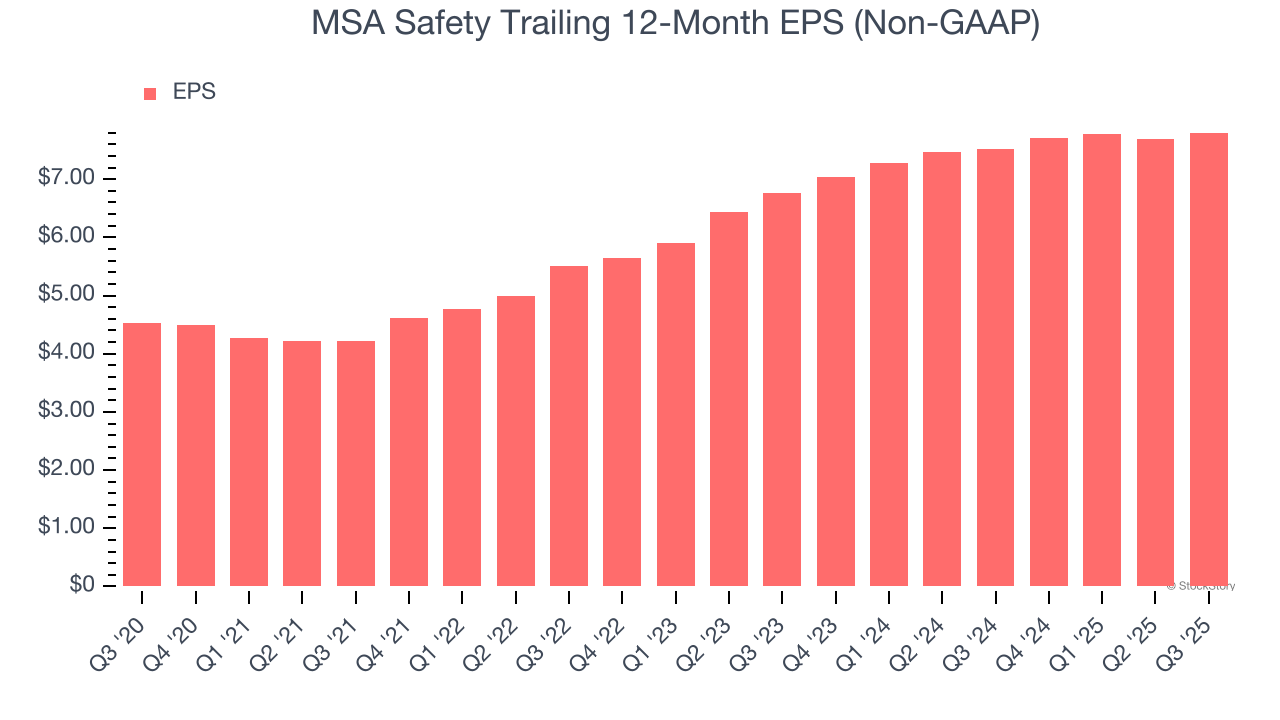
3. Recent EPS Growth Below Our Standards
Although long-term earnings trends give us the big picture, we like to analyze EPS over a shorter period to see if we are missing a change in the business.
MSA Safety’s EPS grew at an unimpressive 7.3% compounded annual growth rate over the last two years. On the bright side, this performance was higher than its 3.6% annualized revenue growth and tells us the company became more profitable on a per-share basis as it expanded.
Final Judgment
MSA Safety’s business quality ultimately falls short of our standards. With its shares underperforming the market lately, the stock trades at 18.5× forward P/E (or $155.56 per share). This valuation multiple is fair, but we don’t have much faith in the company. We're pretty confident there are more exciting stocks to buy at the moment. We’d recommend looking at one of our top software and edge computing picks.
Stocks We Like More Than MSA Safety
If your portfolio success hinges on just 4 stocks, your wealth is built on fragile ground. You have a small window to secure high-quality assets before the market widens and these prices disappear.
Don’t wait for the next volatility shock. Check out our Top 5 Growth Stocks for this month. This is a curated list of our High Quality stocks that have generated a market-beating return of 244% over the last five years (as of June 30, 2025).
Stocks that have made our list include now familiar names such as Nvidia (+1,326% between June 2020 and June 2025) as well as under-the-radar businesses like the once-micro-cap company Tecnoglass (+1,754% five-year return). Find your next big winner with StockStory today.
StockStory is growing and hiring equity analyst and marketing roles. Are you a 0 to 1 builder passionate about the markets and AI? See the open roles here.