
John Bean has followed the market’s trajectory closely, rising in tandem with the S&P 500 over the past six months. The stock has climbed by 14.5% to $135.95 per share while the index has gained 11.9%.
Is JBTM a buy right now? Find out in our full research report, it’s free for active Edge members.
Why Does John Bean Spark Debate?
Tracing back to its invention of the mechanical milk bottle filler in 1884, John Bean (NYSE: JBT) designs, manufactures, and sells equipment used for food processing and aviation.
Two Things to Like:
1. Skyrocketing Revenue Shows Strong Momentum
Reviewing a company’s long-term sales performance reveals insights into its quality. Any business can experience short-term success, but top-performing ones enjoy sustained growth for years. Thankfully, John Bean’s 12.2% annualized revenue growth over the last five years was excellent. Its growth beat the average industrials company and shows its offerings resonate with customers.
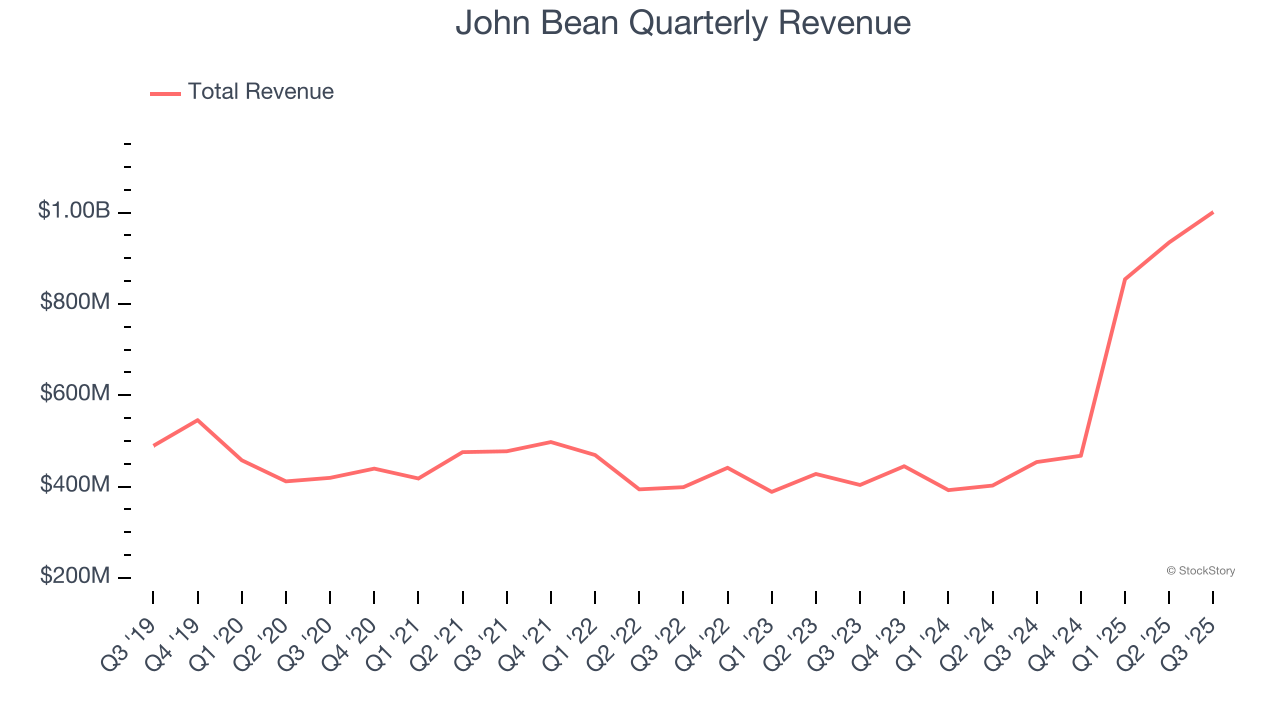
2. Projected Revenue Growth Is Remarkable
Forecasted revenues by Wall Street analysts signal a company’s potential. Predictions may not always be accurate, but accelerating growth typically boosts valuation multiples and stock prices while slowing growth does the opposite, though some deceleration is natural as businesses become larger.
Over the next 12 months, sell-side analysts expect John Bean’s revenue to rise by 21.1%. While this projection is below its 40% annualized growth rate for the past two years, it is eye-popping and implies the market is forecasting success for its products and services.
One Reason to be Careful:
Slow Organic Growth Suggests Waning Demand In Core Business
In addition to reported revenue, organic revenue is a useful data point for analyzing General Industrial Machinery companies. This metric gives visibility into John Bean’s core business because it excludes one-time events such as mergers, acquisitions, and divestitures along with foreign currency fluctuations - non-fundamental factors that can manipulate the income statement.
Over the last two years, John Bean’s organic revenue averaged 2.8% year-on-year growth. This performance was underwhelming and suggests it may need to improve its products, pricing, or go-to-market strategy, which can add an extra layer of complexity to its operations. 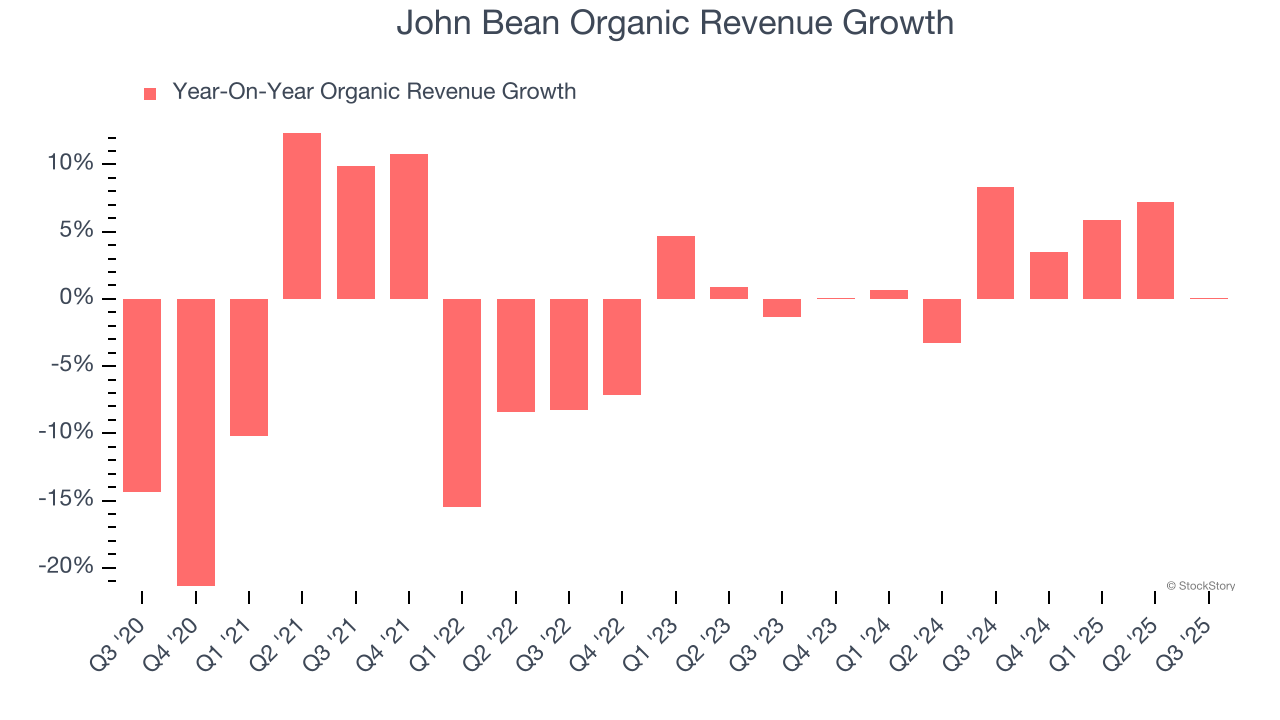
Final Judgment
John Bean’s merits more than compensate for its flaws, but at $135.95 per share (or 17.6× forward P/E), is now the right time to buy the stock? See for yourself in our comprehensive research report, it’s free for active Edge members .
High-Quality Stocks for All Market Conditions
If your portfolio success hinges on just 4 stocks, your wealth is built on fragile ground. You have a small window to secure high-quality assets before the market widens and these prices disappear.
Don’t wait for the next volatility shock. Check out our Top 5 Growth Stocks for this month. This is a curated list of our High Quality stocks that have generated a market-beating return of 244% over the last five years (as of June 30, 2025).
Stocks that have made our list include now familiar names such as Nvidia (+1,326% between June 2020 and June 2025) as well as under-the-radar businesses like the once-small-cap company Exlservice (+354% five-year return). Find your next big winner with StockStory today.
StockStory is growing and hiring equity analyst and marketing roles. Are you a 0 to 1 builder passionate about the markets and AI? See the open roles here.


