Kitchenware and home goods retailer Williams-Sonoma (NYSE: WSM) beat Wall Street’s revenue expectations in Q3 CY2025, with sales up 4.6% year on year to $1.88 billion. Its GAAP profit of $1.96 per share was 4.7% above analysts’ consensus estimates.
Is now the time to buy Williams-Sonoma? Find out by accessing our full research report, it’s free for active Edge members.
Williams-Sonoma (WSM) Q3 CY2025 Highlights:
- Revenue: $1.88 billion vs analyst estimates of $1.87 billion (4.6% year-on-year growth, 0.6% beat)
- EPS (GAAP): $1.96 vs analyst estimates of $1.87 (4.7% beat)
- Adjusted EBITDA: $406.8 million vs analyst estimates of $368.4 million (21.6% margin, 10.4% beat)
- Operating Margin: 17%, in line with the same quarter last year
- Free Cash Flow Margin: 13.2%, up from 9.4% in the same quarter last year
- Locations: 513 at quarter end, down from 525 in the same quarter last year
- Same-Store Sales rose 4% year on year (-2.9% in the same quarter last year)
- Market Capitalization: $22.01 billion
“We are proud to deliver strong results in the third quarter of 2025 with an accelerating positive top-line comp and continued outperformance in profitability. In Q3, our comp came in above expectations at 4.0%, with another quarter of positive comps in all brands. Operating margin came in at 17.0%, expanding 10 basis points, with earnings per share of $1.96, growing 4.8% year-over-year. We are encouraged by our continued strong performance, and are confident in our outlook for Q4. We are reiterating full year comparable brand revenue growth to be in the range of 2% to 5%, and we are raising our bottom-line guidance to an operating margin of 17.8% to 18.1%,” said Laura Alber, President and Chief Executive Officer.
Company Overview
Started in 1956 as a store specializing in French cookware, Williams-Sonoma (NYSE: WSM) is a specialty retailer of higher-end kitchenware, home goods, and furniture.
Revenue Growth
A company’s long-term sales performance can indicate its overall quality. Even a bad business can shine for one or two quarters, but a top-tier one grows for years.
With $7.91 billion in revenue over the past 12 months, Williams-Sonoma is a mid-sized retailer, which sometimes brings disadvantages compared to larger competitors benefiting from better economies of scale.
As you can see below, Williams-Sonoma’s 5% annualized revenue growth over the last six years (we compare to 2019 to normalize for COVID-19 impacts) was tepid as it closed stores.
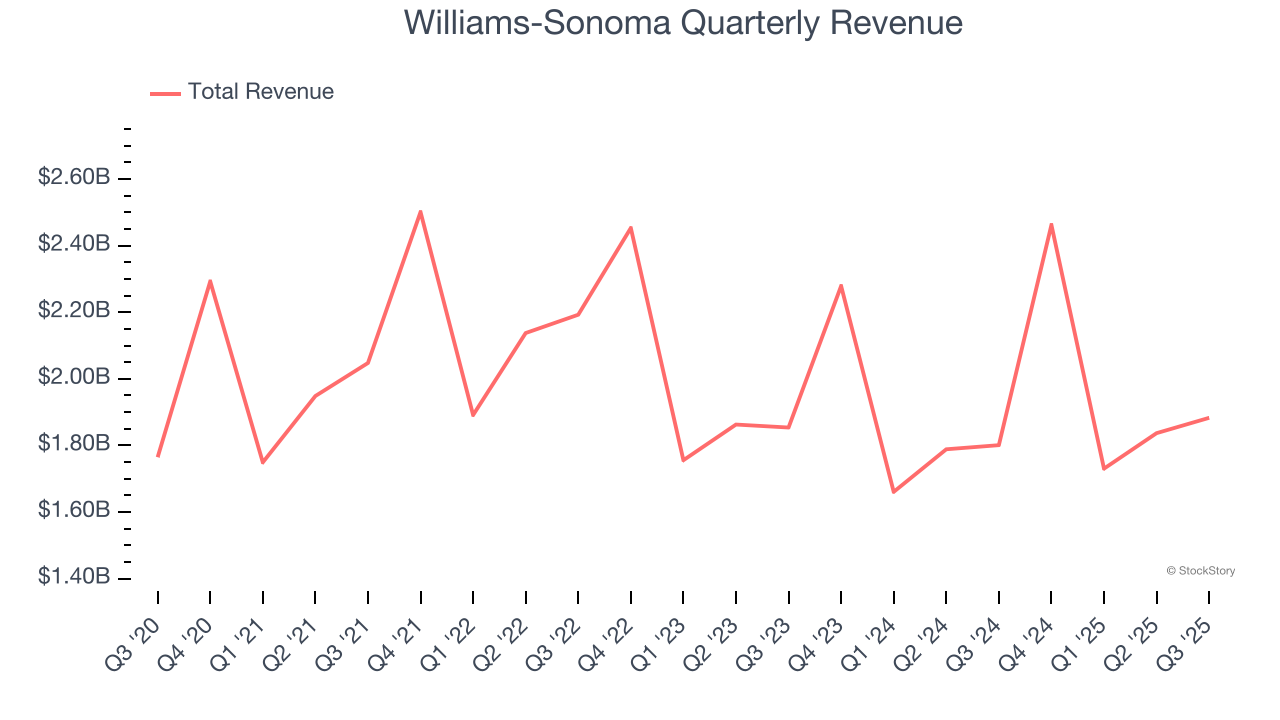
This quarter, Williams-Sonoma reported modest year-on-year revenue growth of 4.6% but beat Wall Street’s estimates by 0.6%.
Looking ahead, sell-side analysts expect revenue to grow 1.3% over the next 12 months, a deceleration versus the last six years. This projection is underwhelming and suggests its products will see some demand headwinds.
While Wall Street chases Nvidia at all-time highs, an under-the-radar semiconductor supplier is dominating a critical AI component these giants can’t build without. Click here to access our free report one of our favorites growth stories.
Store Performance
Number of Stores
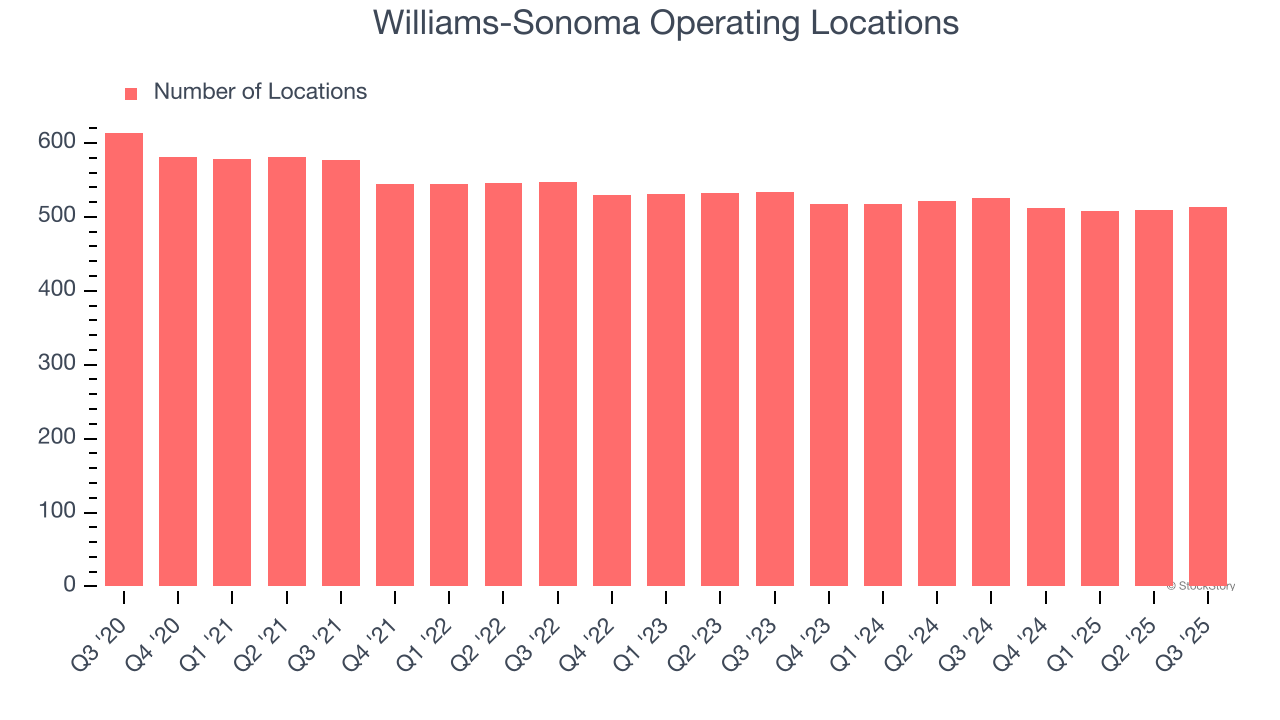
A retailer’s store count influences how much it can sell and how quickly revenue can grow.
Williams-Sonoma listed 513 locations in the latest quarter and has generally closed its stores over the last two years, averaging 2% annual declines.
When a retailer shutters stores, it usually means that brick-and-mortar demand is less than supply, and it is responding by closing underperforming locations to improve profitability.
Same-Store Sales
The change in a company's store base only tells one side of the story. The other is the performance of its existing locations and e-commerce sales, which informs management teams whether they should expand or downsize their physical footprints. Same-store sales provides a deeper understanding of this issue because it measures organic growth at brick-and-mortar shops for at least a year.
Williams-Sonoma’s demand within its existing locations has barely increased over the last two years as its same-store sales were flat. This performance isn’t ideal, and Williams-Sonoma is attempting to boost same-store sales by closing stores (fewer locations sometimes lead to higher same-store sales).
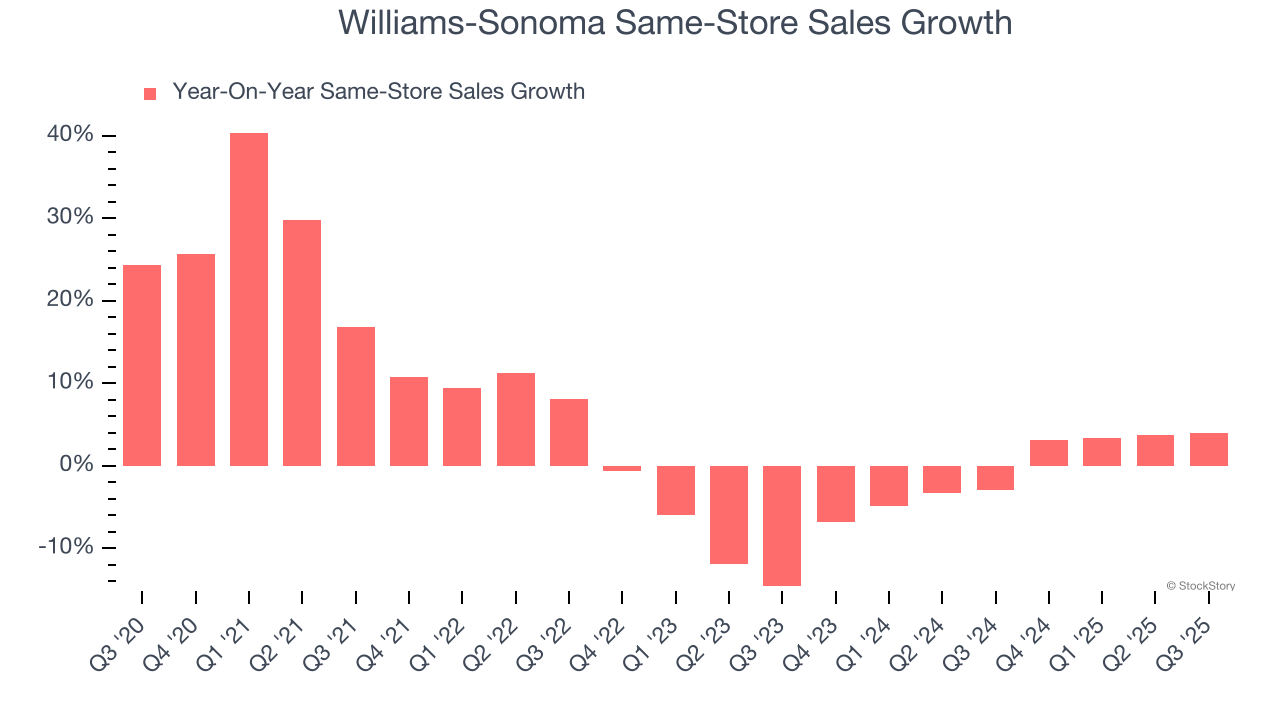
In the latest quarter, Williams-Sonoma’s same-store sales rose 4% year on year. This growth was a well-appreciated turnaround from its historical levels, showing the business is regaining momentum.
Key Takeaways from Williams-Sonoma’s Q3 Results
We were impressed by how significantly Williams-Sonoma blew past analysts’ EBITDA expectations this quarter. We were also glad its gross margin outperformed Wall Street’s estimates. Overall, we think this was a decent quarter with some key metrics above expectations. Investors were likely hoping for more, and shares traded down 6.5% to $169 immediately following the results.
Is Williams-Sonoma an attractive investment opportunity right now? We think that the latest quarter is only one piece of the longer-term business quality puzzle. Quality, when combined with valuation, can help determine if the stock is a buy. We cover that in our actionable full research report which you can read here, it’s free for active Edge members.