
Over the past six months, The Pennant Group’s shares (currently trading at $26.51) have posted a disappointing 9.9% loss, well below the S&P 500’s 11.3% gain. This may have investors wondering how to approach the situation.
Is there a buying opportunity in The Pennant Group, or does it present a risk to your portfolio? Check out our in-depth research report to see what our analysts have to say, it’s free for active Edge members.
Why Is The Pennant Group Not Exciting?
Even though the stock has become cheaper, we're swiping left on The Pennant Group for now. Here are three reasons there are better opportunities than PNTG and a stock we'd rather own.
1. Fewer Distribution Channels Limit its Ceiling
Larger companies benefit from economies of scale, where fixed costs like infrastructure, technology, and administration are spread over a higher volume of goods or services, reducing the cost per unit. Scale can also lead to bargaining power with suppliers, greater brand recognition, and more investment firepower. A virtuous cycle can ensue if a scaled company plays its cards right.
With just $847.3 million in revenue over the past 12 months, The Pennant Group is a small company in an industry where scale matters. This makes it difficult to build trust with customers because healthcare is heavily regulated, complex, and resource-intensive.
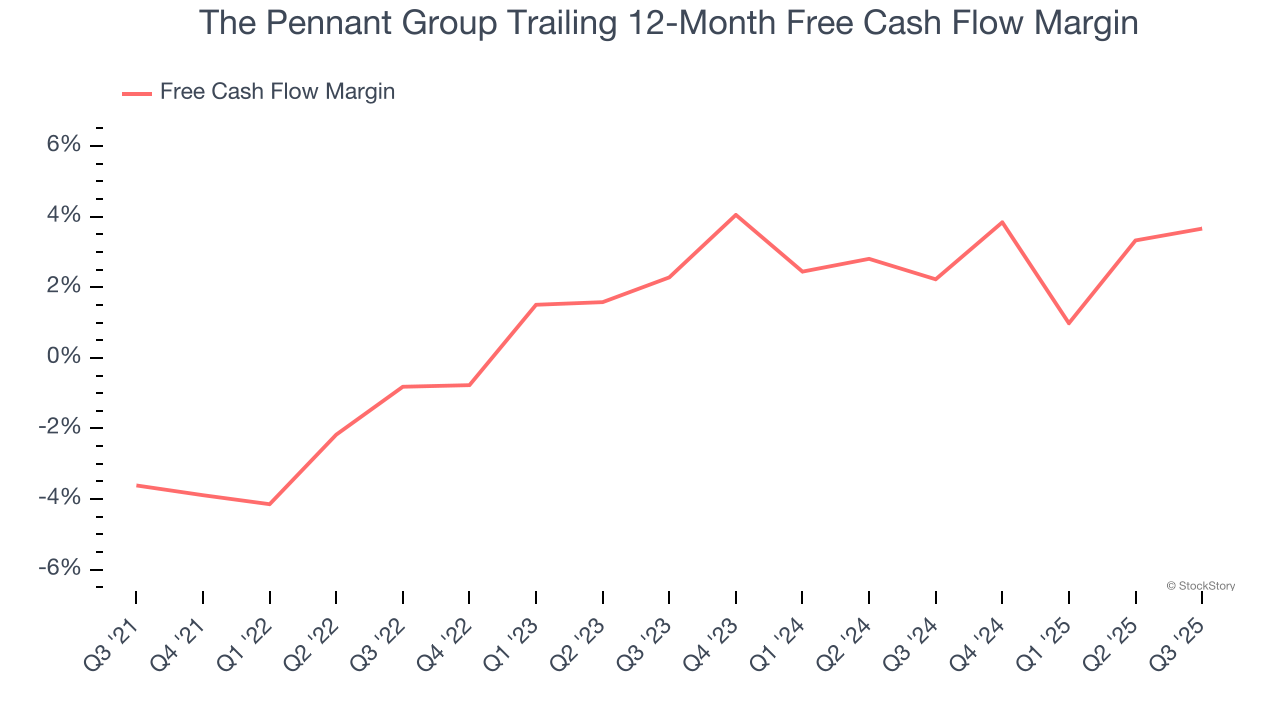
2. Mediocre Free Cash Flow Margin Limits Reinvestment Potential
Free cash flow isn't a prominently featured metric in company financials and earnings releases, but we think it's telling because it accounts for all operating and capital expenses, making it tough to manipulate. Cash is king.
The Pennant Group has shown mediocre cash profitability over the last five years, giving the company limited opportunities to return capital to shareholders. Its free cash flow margin averaged 1.3%, subpar for a healthcare business.
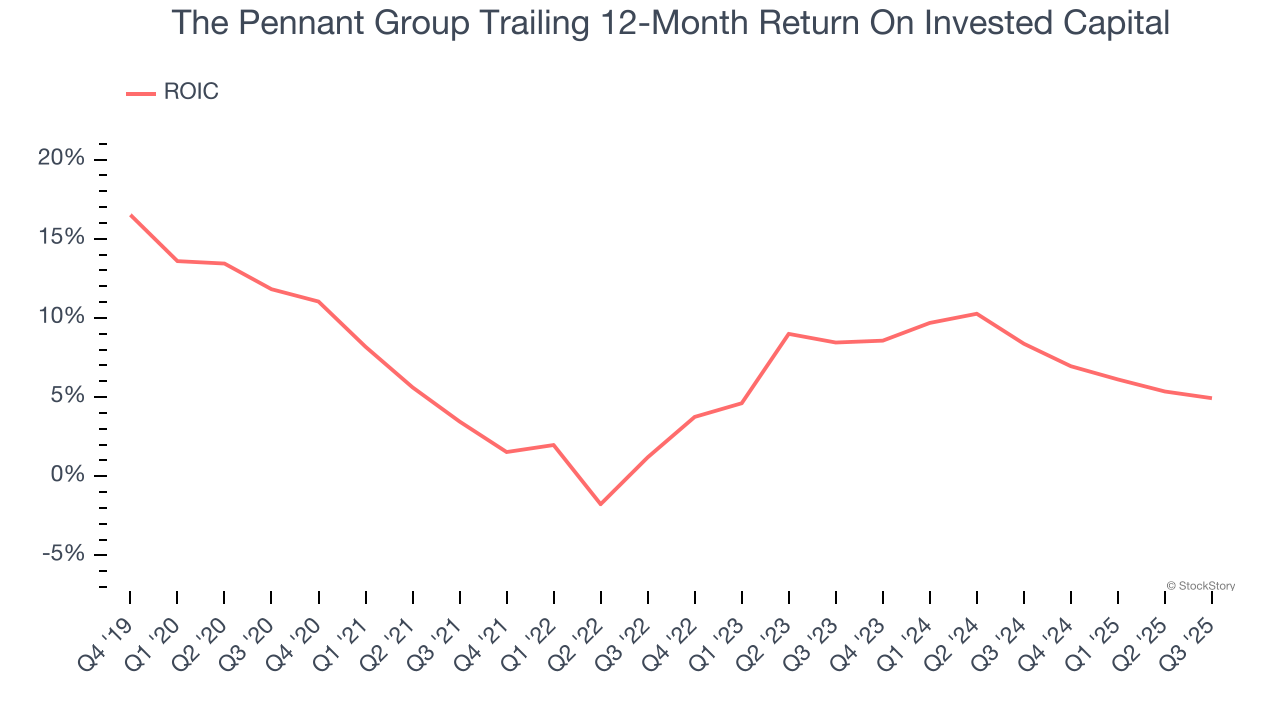
3. Previous Growth Initiatives Haven’t Impressed
Growth gives us insight into a company’s long-term potential, but how capital-efficient was that growth? Enter ROIC, a metric showing how much operating profit a company generates relative to the money it has raised (debt and equity).
The Pennant Group historically did a mediocre job investing in profitable growth initiatives. Its five-year average ROIC was 5.3%, somewhat low compared to the best healthcare companies that consistently pump out 20%+.
Final Judgment
The Pennant Group isn’t a terrible business, but it isn’t one of our picks. Following the recent decline, the stock trades at 20.4× forward P/E (or $26.51 per share). While this valuation is reasonable, we don’t really see a big opportunity at the moment. We're fairly confident there are better investments elsewhere. Let us point you toward a fast-growing restaurant franchise with an A+ ranch dressing sauce.
High-Quality Stocks for All Market Conditions
Your portfolio can’t afford to be based on yesterday’s story. The risk in a handful of heavily crowded stocks is rising daily.
The names generating the next wave of massive growth are right here in our Top 9 Market-Beating Stocks. This is a curated list of our High Quality stocks that have generated a market-beating return of 244% over the last five years (as of June 30, 2025).
Stocks that have made our list include now familiar names such as Nvidia (+1,326% between June 2020 and June 2025) as well as under-the-radar businesses like the once-small-cap company Comfort Systems (+782% five-year return). Find your next big winner with StockStory today.
StockStory is growing and hiring equity analyst and marketing roles. Are you a 0 to 1 builder passionate about the markets and AI? See the open roles here.


