Wendy’s stock price has taken a beating over the past six months, shedding 33.3% of its value and falling to $8.17 per share. This may have investors wondering how to approach the situation.
Is there a buying opportunity in Wendy's, or does it present a risk to your portfolio? Get the full stock story straight from our expert analysts, it’s free for active Edge members.
Why Is Wendy's Not Exciting?
Despite the more favorable entry price, we're swiping left on Wendy's for now. Here are three reasons there are better opportunities than WEN and a stock we'd rather own.
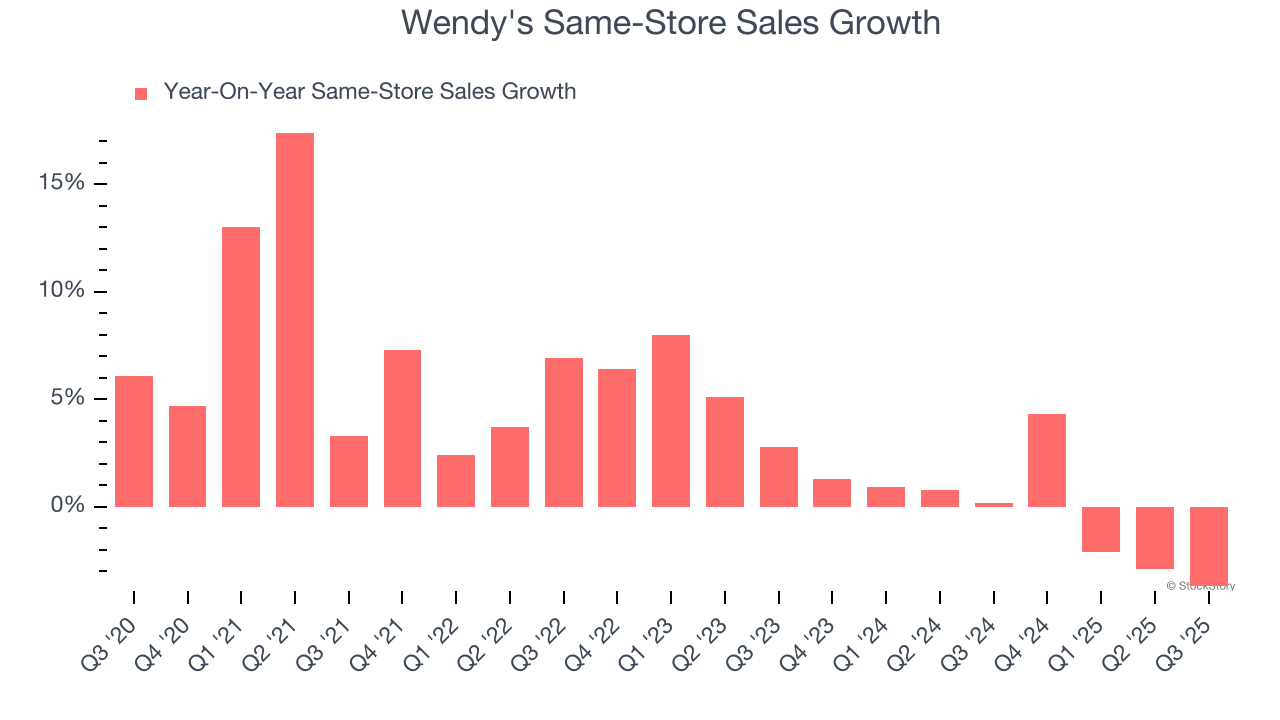
1. Flat Same-Store Sales Indicate Weak Demand
Same-store sales show the change in sales at restaurants open for at least a year. This is a key performance indicator because it measures organic growth.
Wendy’s demand within its existing dining locations has barely increased over the last two years as its same-store sales were flat.
2. Projected Revenue Growth Shows Limited Upside
Forecasted revenues by Wall Street analysts signal a company’s potential. Predictions may not always be accurate, but accelerating growth typically boosts valuation multiples and stock prices while slowing growth does the opposite.
Over the next 12 months, sell-side analysts expect Wendy’s revenue to stall, a deceleration versus This projection is underwhelming and implies its menu offerings will face some demand challenges.
3. High Debt Levels Increase Risk
As long-term investors, the risk we care about most is the permanent loss of capital, which can happen when a company goes bankrupt or raises money from a disadvantaged position. This is separate from short-term stock price volatility, something we are much less bothered by.
Wendy’s $4.12 billion of debt exceeds the $291.4 million of cash on its balance sheet. Furthermore, its 7× net-debt-to-EBITDA ratio (based on its EBITDA of $546.7 million over the last 12 months) shows the company is overleveraged.
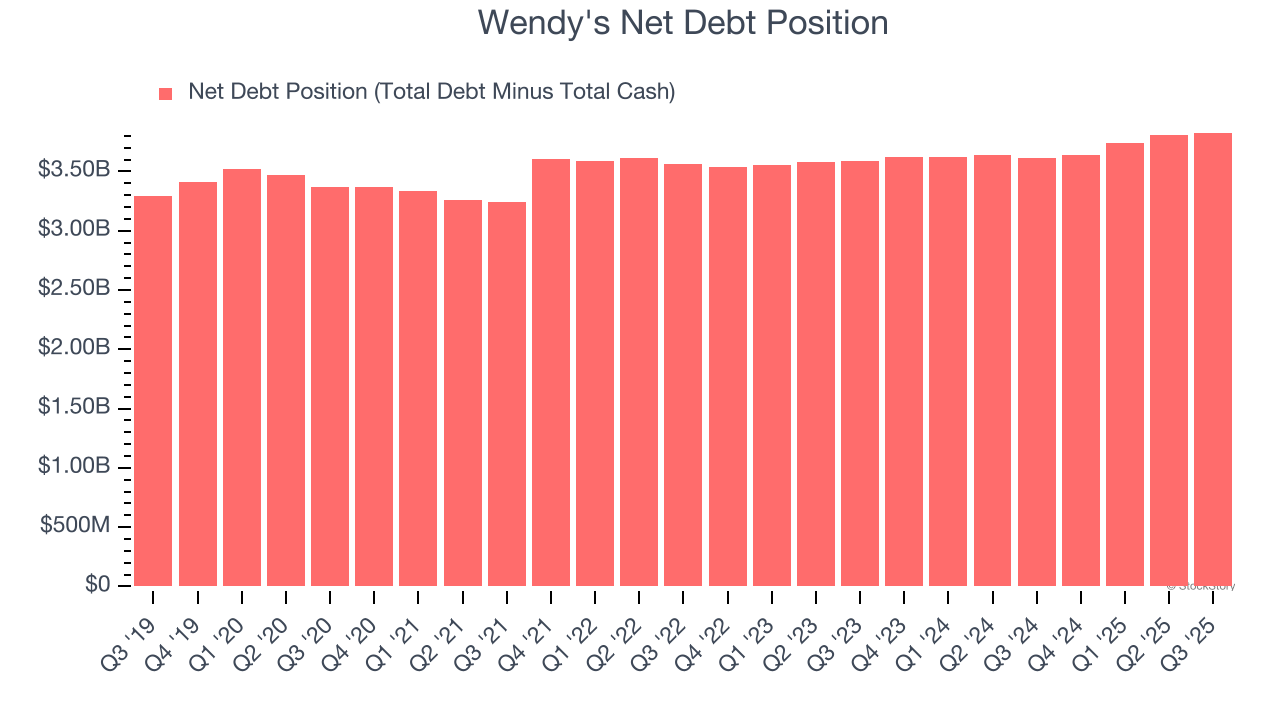
At this level of debt, incremental borrowing becomes increasingly expensive and credit agencies could downgrade the company’s rating if profitability falls. Wendy's could also be backed into a corner if the market turns unexpectedly – a situation we seek to avoid as investors in high-quality companies.
We hope Wendy's can improve its balance sheet and remain cautious until it increases its profitability or pays down its debt.
Final Judgment
Wendy’s business quality ultimately falls short of our standards. Following the recent decline, the stock trades at 9.7× forward P/E (or $8.17 per share). While this valuation is optically cheap, the potential downside is big given its shaky fundamentals. We're pretty confident there are more exciting stocks to buy at the moment. Let us point you toward the most entrenched endpoint security platform on the market.
High-Quality Stocks for All Market Conditions
Your portfolio can’t afford to be based on yesterday’s story. The risk in a handful of heavily crowded stocks is rising daily.
The names generating the next wave of massive growth are right here in our Top 9 Market-Beating Stocks. This is a curated list of our High Quality stocks that have generated a market-beating return of 244% over the last five years (as of June 30, 2025).
Stocks that have made our list include now familiar names such as Nvidia (+1,326% between June 2020 and June 2025) as well as under-the-radar businesses like the once-small-cap company Comfort Systems (+782% five-year return). Find your next big winner with StockStory today.
StockStory is growing and hiring equity analyst and marketing roles. Are you a 0 to 1 builder passionate about the markets and AI? See the open roles here.