
Online vehicle auction company Copart (NASDAQ: CPRT) fell short of the markets revenue expectations in Q3 CY2025, with sales flat year on year at $1.16 billion. Its GAAP profit of $0.41 per share was 3.5% above analysts’ consensus estimates.
Is now the time to buy Copart? Find out by accessing our full research report, it’s free for active Edge members.
Copart (CPRT) Q3 CY2025 Highlights:
- Revenue: $1.16 billion vs analyst estimates of $1.18 billion (flat year on year, 2.1% miss)
- EPS (GAAP): $0.41 vs analyst estimates of $0.40 (3.5% beat)
- Adjusted EBITDA: $484.9 million vs analyst estimates of $494.9 million (42% margin, 2% miss)
- Operating Margin: 37.3%, up from 35.4% in the same quarter last year
- Free Cash Flow Margin: 37%, up from 21.4% in the same quarter last year
- Market Capitalization: $40.04 billion
Company Overview
Starting as a single salvage yard in California in 1982, Copart (NASDAQ: CPRT) operates an online auction platform that connects sellers of damaged and salvage vehicles with buyers ranging from dismantlers and rebuilders to used car dealers and exporters.
Revenue Growth
A company’s long-term performance is an indicator of its overall quality. Any business can put up a good quarter or two, but many enduring ones grow for years.
With $4.66 billion in revenue over the past 12 months, Copart is one of the larger companies in the business services industry and benefits from a well-known brand that influences purchasing decisions.
As you can see below, Copart grew its sales at an incredible 15.7% compounded annual growth rate over the last five years. This is a great starting point for our analysis because it shows Copart’s demand was higher than many business services companies.
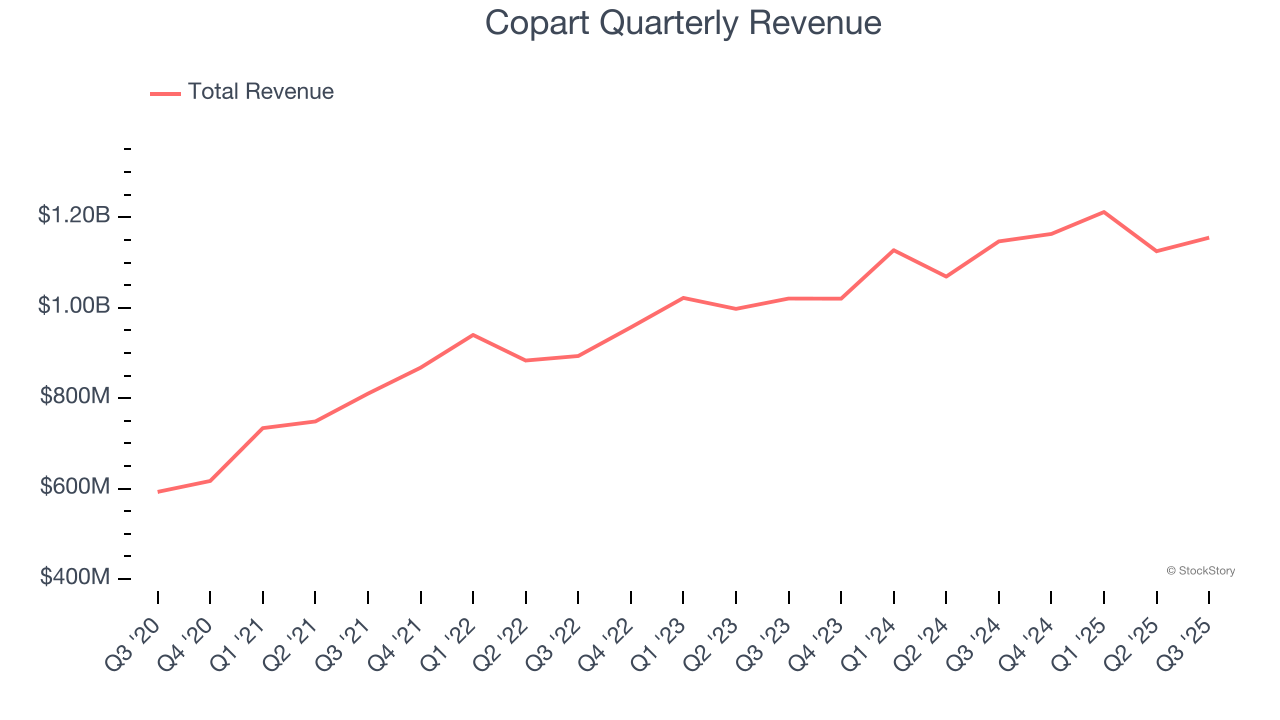
Long-term growth is the most important, but within business services, a half-decade historical view may miss new innovations or demand cycles. Copart’s annualized revenue growth of 7.9% over the last two years is below its five-year trend, but we still think the results suggest healthy demand. 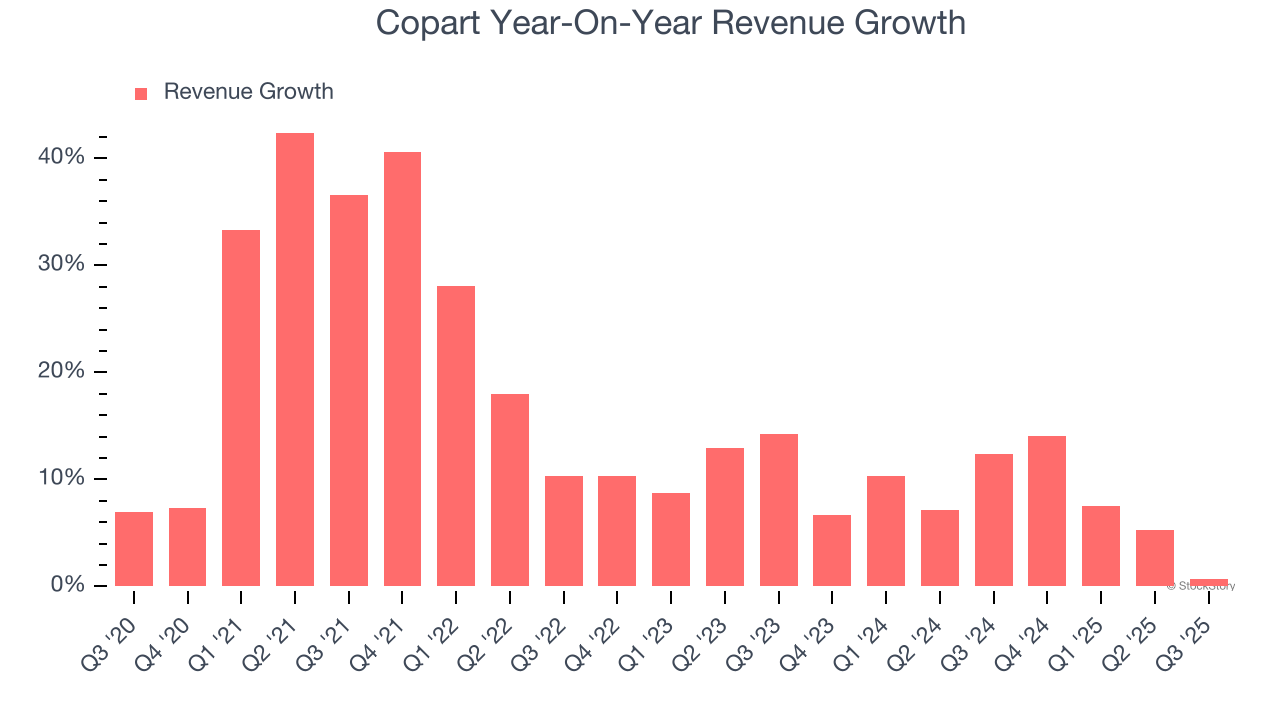
Copart also breaks out the revenue for its most important segment, Service
. Over the last two years, Copart’s Service
revenue (processing and selling cars) averaged 9.3% year-on-year growth. 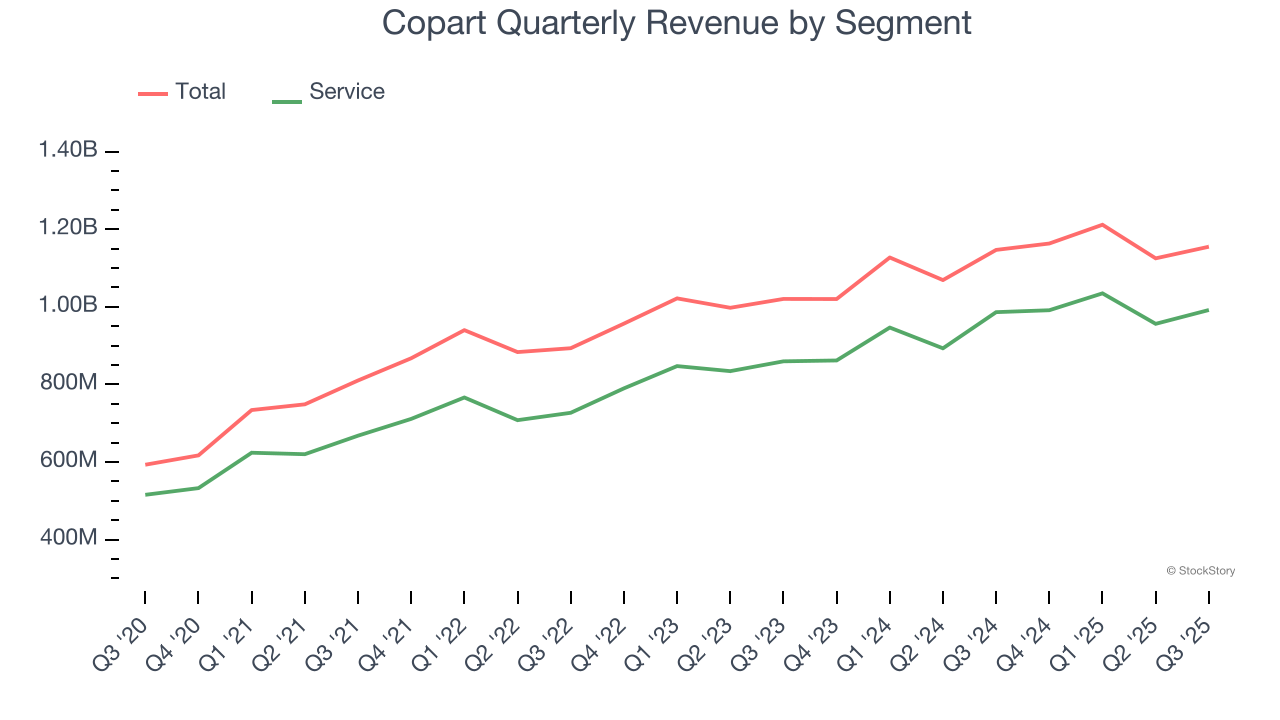
This quarter, Copart’s $1.16 billion of revenue was flat year on year, falling short of Wall Street’s estimates.
Looking ahead, sell-side analysts expect revenue to grow 7.4% over the next 12 months, similar to its two-year rate. This projection is healthy and indicates the market sees success for its products and services.
Software is eating the world and there is virtually no industry left that has been untouched by it. That drives increasing demand for tools helping software developers do their jobs, whether it be monitoring critical cloud infrastructure, integrating audio and video functionality, or ensuring smooth content streaming. Click here to access a free report on our 3 favorite stocks to play this generational megatrend.
Operating Margin
Copart has been a well-oiled machine over the last five years. It demonstrated elite profitability for a business services business, boasting an average operating margin of 38.2%.
Looking at the trend in its profitability, Copart’s operating margin decreased by 4.9 percentage points over the last five years. This raises questions about the company’s expense base because its revenue growth should have given it leverage on its fixed costs, resulting in better economies of scale and profitability.
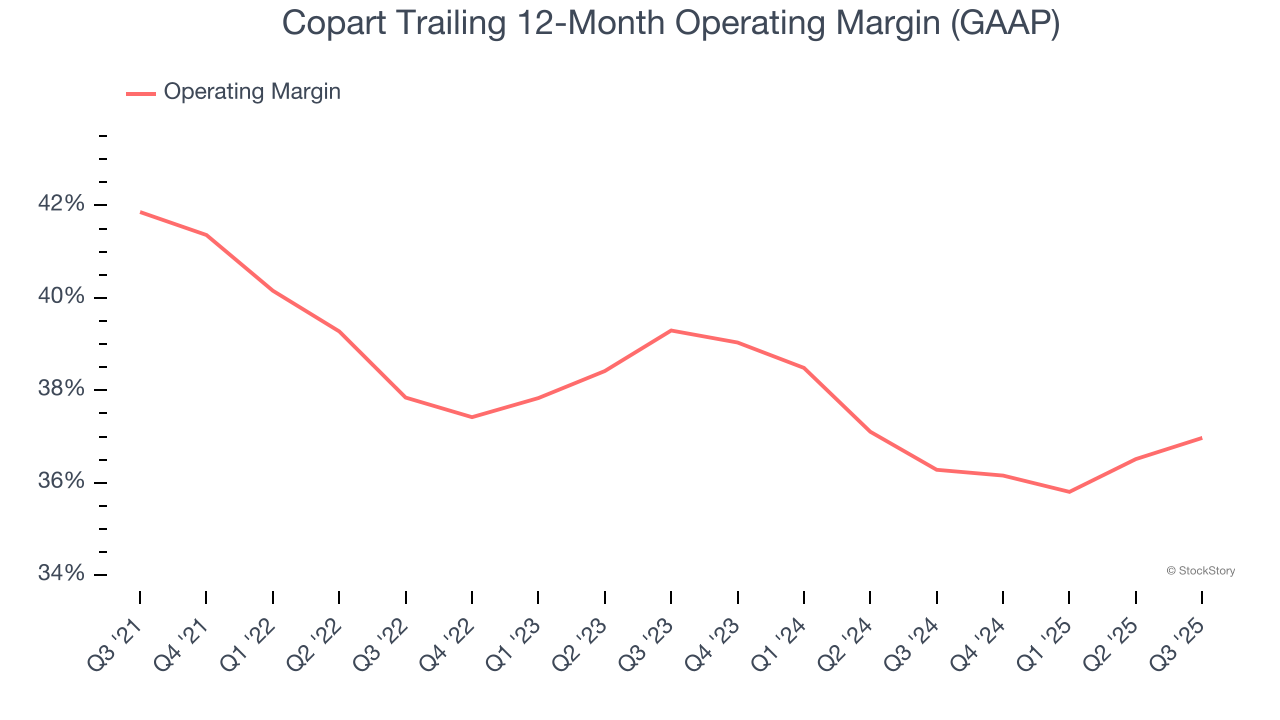
This quarter, Copart generated an operating margin profit margin of 37.3%, up 1.9 percentage points year on year. This increase was a welcome development and shows it was more efficient.
Earnings Per Share
We track the long-term change in earnings per share (EPS) for the same reason as long-term revenue growth. Compared to revenue, however, EPS highlights whether a company’s growth is profitable.
Copart’s EPS grew at an astounding 18.1% compounded annual growth rate over the last five years, higher than its 15.7% annualized revenue growth. However, we take this with a grain of salt because its operating margin didn’t improve and it didn’t repurchase its shares, meaning the delta came from reduced interest expenses or taxes.
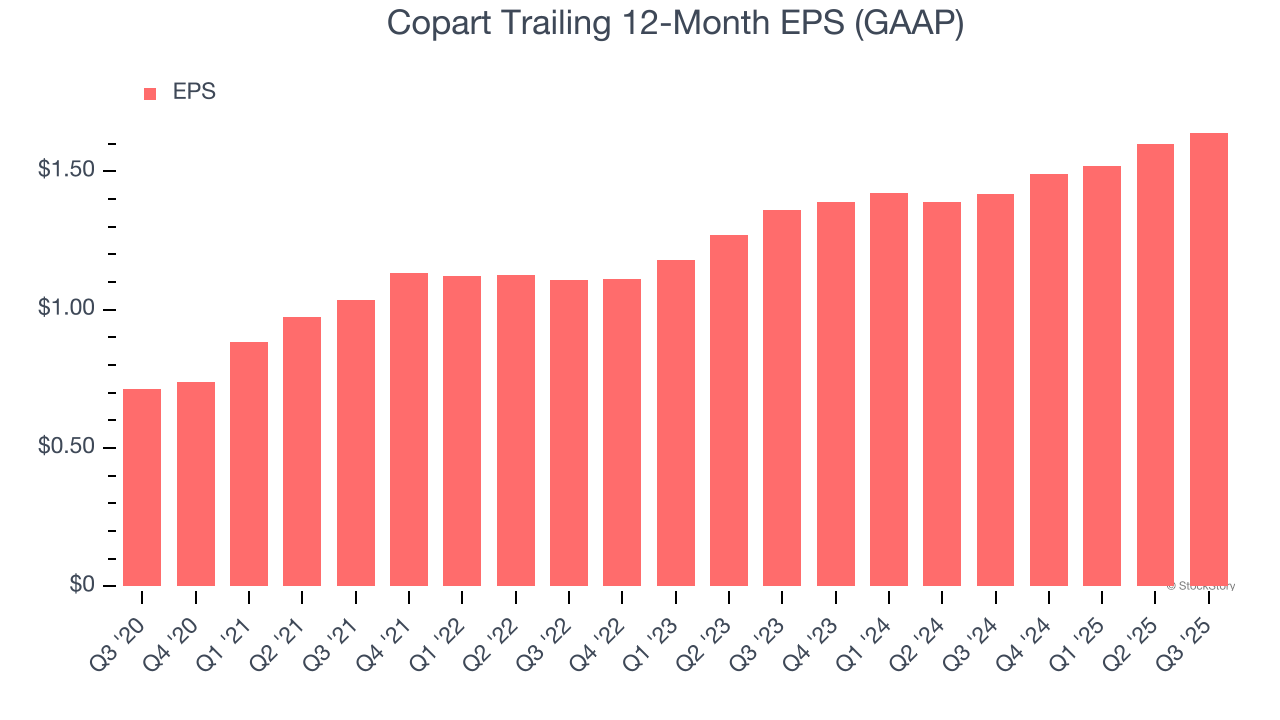
Like with revenue, we analyze EPS over a more recent period because it can provide insight into an emerging theme or development for the business.
For Copart, its two-year annual EPS growth of 9.8% was lower than its five-year trend. This wasn’t great, but at least the company was successful in other measures of financial health.
In Q3, Copart reported EPS of $0.41, up from $0.37 in the same quarter last year. This print beat analysts’ estimates by 3.5%. Over the next 12 months, Wall Street expects Copart’s full-year EPS of $1.64 to grow 5.8%.
Key Takeaways from Copart’s Q3 Results
It was good to see Copart beat analysts’ EPS expectations this quarter. On the other hand, its revenue missed. Overall, this quarter could have been better. The stock traded down 2.2% to $40.09 immediately following the results.
Copart may have had a tough quarter, but does that actually create an opportunity to invest right now? The latest quarter does matter, but not nearly as much as longer-term fundamentals and valuation, when deciding if the stock is a buy. We cover that in our actionable full research report which you can read here, it’s free for active Edge members.