Search AI platform provider Elastic (NYSE: ESTC) reported Q3 CY2025 results exceeding the market’s revenue expectations, with sales up 15.9% year on year to $423.5 million. Guidance for next quarter’s revenue was optimistic at $438 million at the midpoint, 2% above analysts’ estimates. Its non-GAAP profit of $0.64 per share was 11.1% above analysts’ consensus estimates.
Is now the time to buy Elastic? Find out by accessing our full research report, it’s free for active Edge members.
Elastic (ESTC) Q3 CY2025 Highlights:
- Revenue: $423.5 million vs analyst estimates of $417.9 million (15.9% year-on-year growth, 1.3% beat)
- Adjusted EPS: $0.64 vs analyst estimates of $0.58 (11.1% beat)
- Adjusted Operating Income: $69.8 million vs analyst estimates of $67.02 million (16.5% margin, 4.1% beat)
- The company lifted its revenue guidance for the full year to $1.72 billion at the midpoint from $1.68 billion, a 2% increase
- Management raised its full-year Adjusted EPS guidance to $2.43 at the midpoint, a 4.7% increase
- Operating Margin: -1.9%, in line with the same quarter last year
- Free Cash Flow Margin: 6.1%, down from 25.1% in the previous quarter
- Net Revenue Retention Rate: 112%, in line with the previous quarter
- Billings: $399.6 million at quarter end, up 4.3% year on year
- Market Capitalization: $9.38 billion
“Q2 was an outstanding quarter for Elastic. We beat the high end of our guidance across all metrics. Our strength was driven by robust growth across the company with AI positively impacting all areas of our business,” said Ash Kulkarni, chief executive officer, Elastic.
Company Overview
Built on the powerful open-source Elasticsearch technology that powers search functionality for thousands of websites worldwide, Elastic (NYSE: ESTC) provides a search and AI platform that helps organizations find insights from their data, monitor applications, and protect against security threats.
Revenue Growth
A company’s long-term performance is an indicator of its overall quality. Even a bad business can shine for one or two quarters, but a top-tier one grows for years. Luckily, Elastic’s sales grew at a solid 25.8% compounded annual growth rate over the last five years. Its growth beat the average software company and shows its offerings resonate with customers.
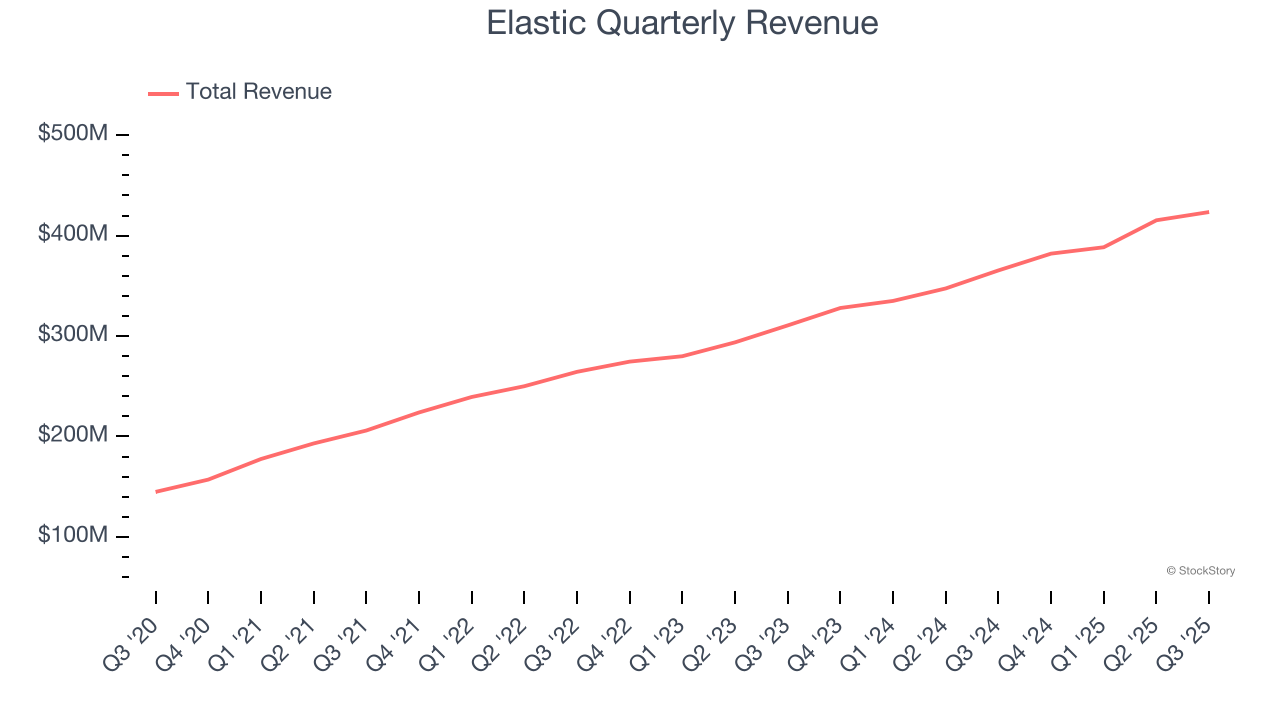
Long-term growth is the most important, but within software, a half-decade historical view may miss new innovations or demand cycles. Elastic’s annualized revenue growth of 17.8% over the last two years is below its five-year trend, but we still think the results suggest healthy demand. 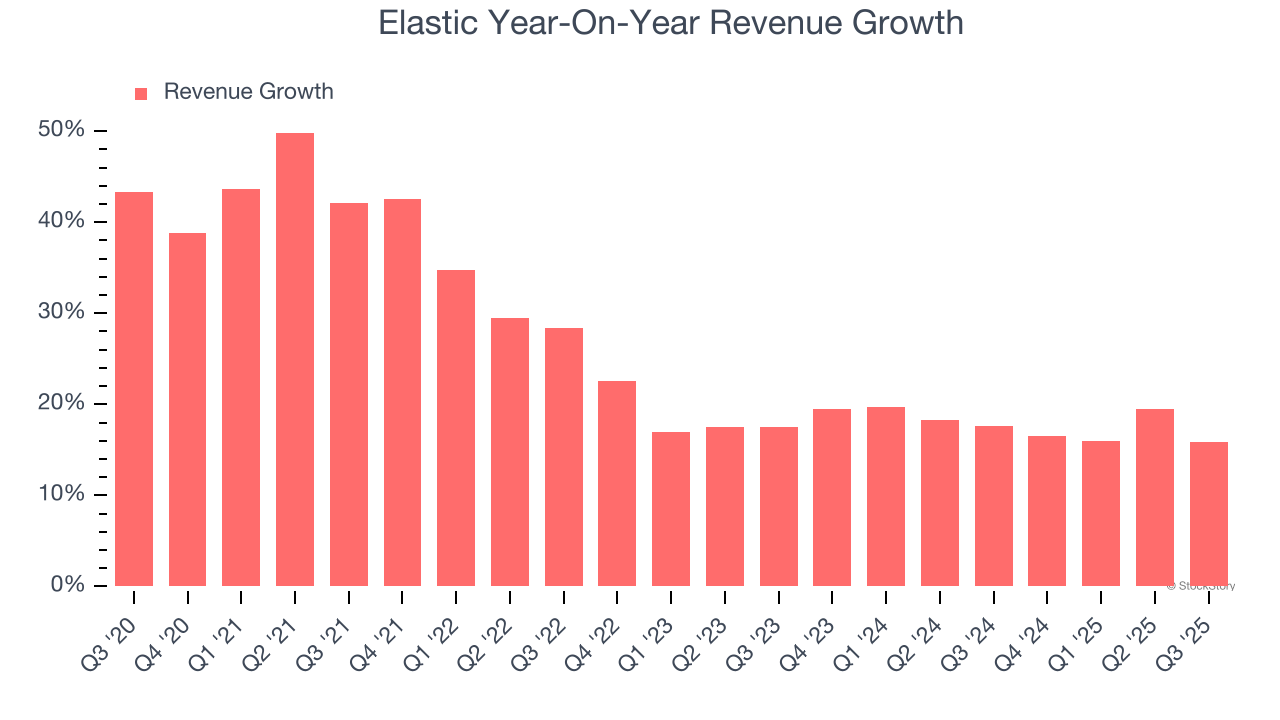
This quarter, Elastic reported year-on-year revenue growth of 15.9%, and its $423.5 million of revenue exceeded Wall Street’s estimates by 1.3%. Company management is currently guiding for a 14.6% year-on-year increase in sales next quarter.
Looking further ahead, sell-side analysts expect revenue to grow 11.9% over the next 12 months, a deceleration versus the last two years. This projection doesn't excite us and indicates its products and services will see some demand headwinds.
While Wall Street chases Nvidia at all-time highs, an under-the-radar semiconductor supplier is dominating a critical AI component these giants can’t build without. Click here to access our free report one of our favorites growth stories.
Billings
Billings is a non-GAAP metric that is often called “cash revenue” because it shows how much money the company has collected from customers in a certain period. This is different from revenue, which must be recognized in pieces over the length of a contract.
Elastic’s billings came in at $399.6 million in Q3, and over the last four quarters, its growth slightly lagged the sector as it averaged 13.8% year-on-year increases. This alternate topline metric grew slower than total sales, meaning the company recognizes revenue faster than it collects cash - a headwind for its liquidity that could also signal a slowdown in future revenue growth. 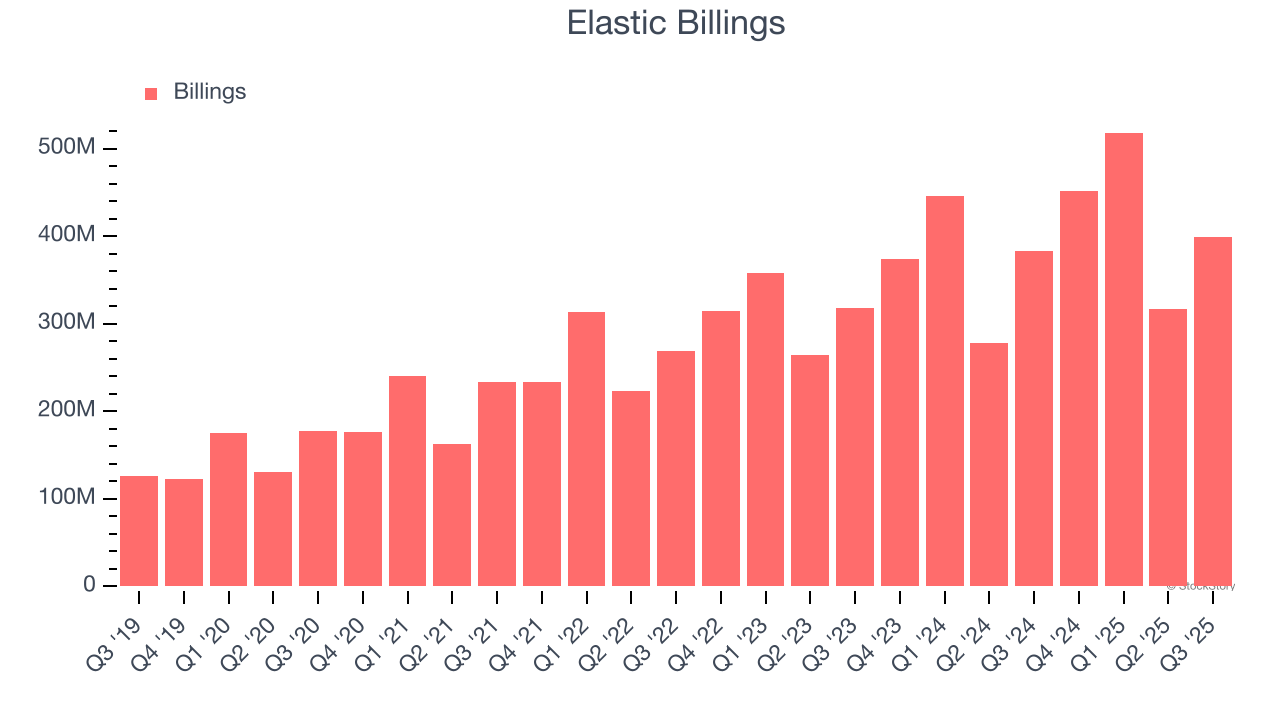
Customer Retention
One of the best parts about the software-as-a-service business model (and a reason why they trade at high valuation multiples) is that customers typically spend more on a company’s products and services over time.
Elastic’s net revenue retention rate, a key performance metric measuring how much money existing customers from a year ago are spending today, was 112% in Q3. This means Elastic would’ve grown its revenue by 12% even if it didn’t win any new customers over the last 12 months.
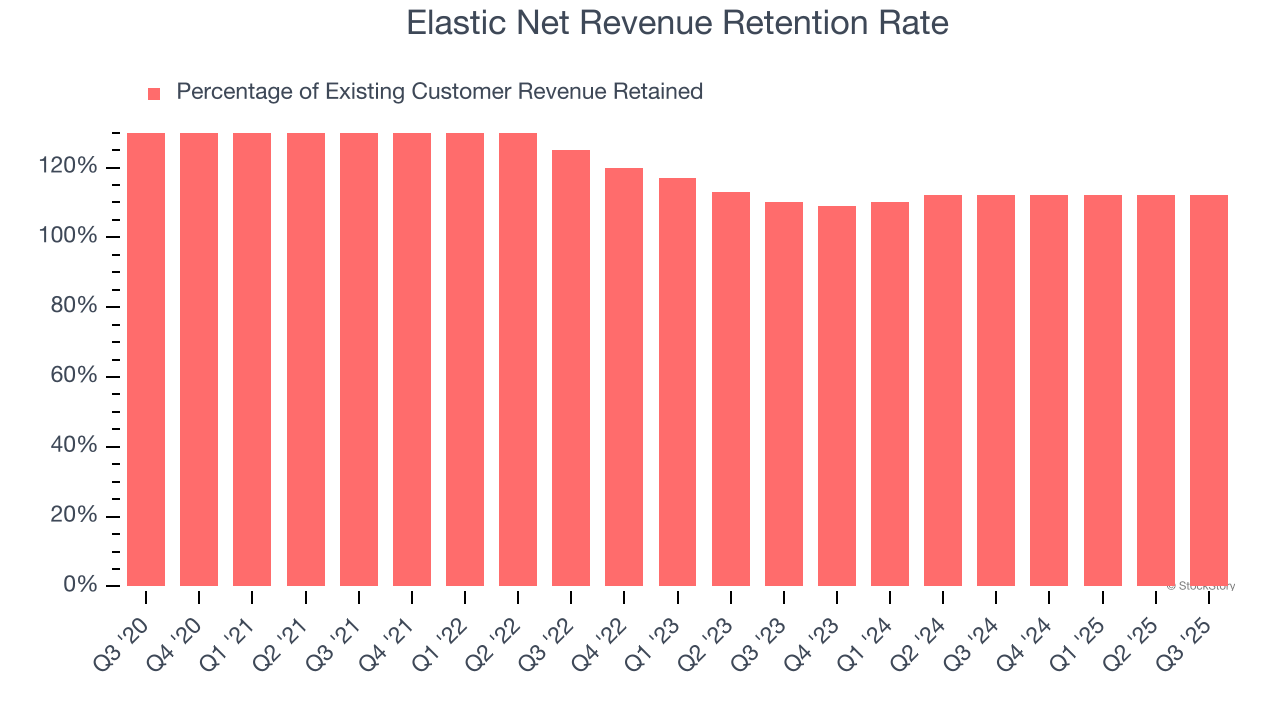
Elastic has a good net retention rate, proving that customers are satisfied with its software and getting more value from it over time, which is always great to see.
Key Takeaways from Elastic’s Q3 Results
We were impressed by Elastic’s optimistic EPS guidance for next quarter, which blew past analysts’ expectations. We were also glad its full-year EPS guidance trumped Wall Street’s estimates. On the other hand, its billings missed. Overall, this print had some key positives. The market seemed to be hoping for more, and the stock traded down 8.3% to $75.24 immediately following the results.
Should you buy the stock or not? The latest quarter does matter, but not nearly as much as longer-term fundamentals and valuation, when deciding if the stock is a buy. We cover that in our actionable full research report which you can read here, it’s free for active Edge members.


