
American Financial Group trades at $137.11 and has moved in lockstep with the market. Its shares have returned 11.6% over the last six months while the S&P 500 has gained 13.7%.
Is now the time to buy American Financial Group, or should you be careful about including it in your portfolio? See what our analysts have to say in our full research report, it’s free for active Edge members.
Why Is American Financial Group Not Exciting?
We're sitting this one out for now. Here are three reasons you should be careful with AFG and a stock we'd rather own.
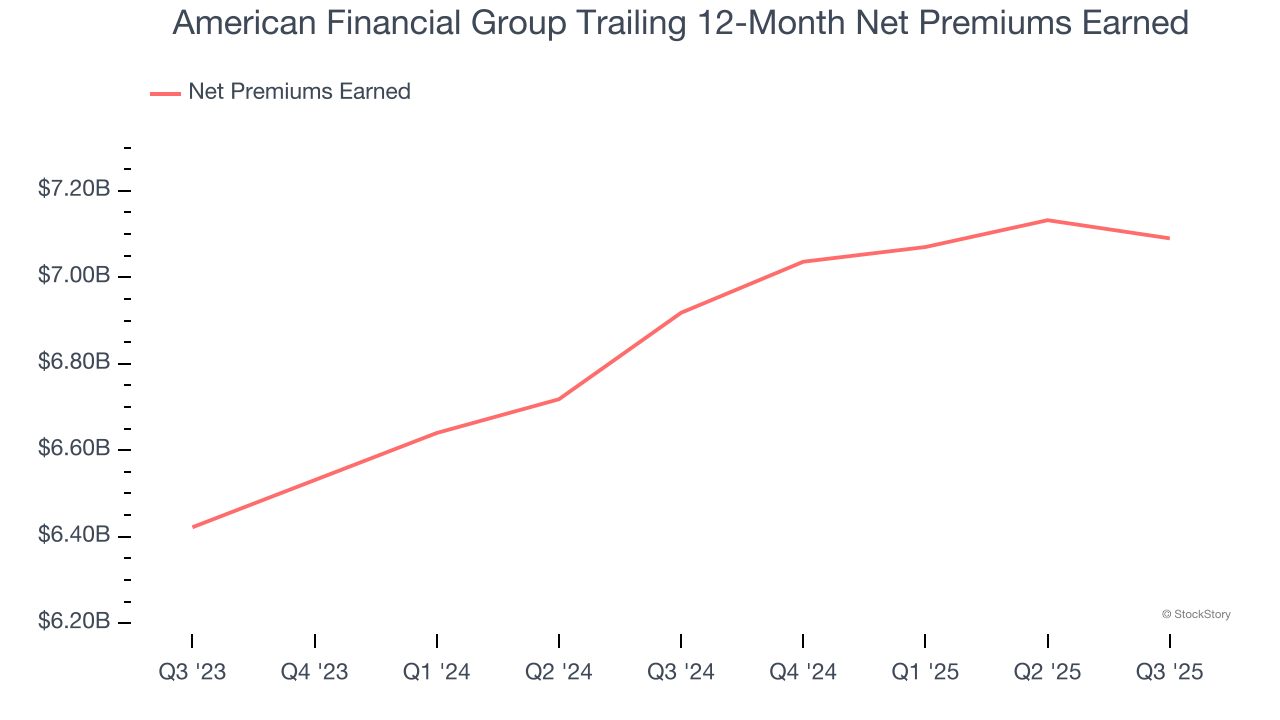
1. Net Premiums Earned Point to Soft Demand
When insurers sell policies, they protect themselves from extremely large losses or an outsized accumulation of losses with reinsurance (insurance for insurance companies). Net premiums earned are:
- Gross premiums - what’s ceded to reinsurers as a risk mitigation and transfer strategy
American Financial Group’s net premiums earned has grown at a 4.8% annualized rate over the last five years, worse than the broader insurance industry and slower than its total revenue.
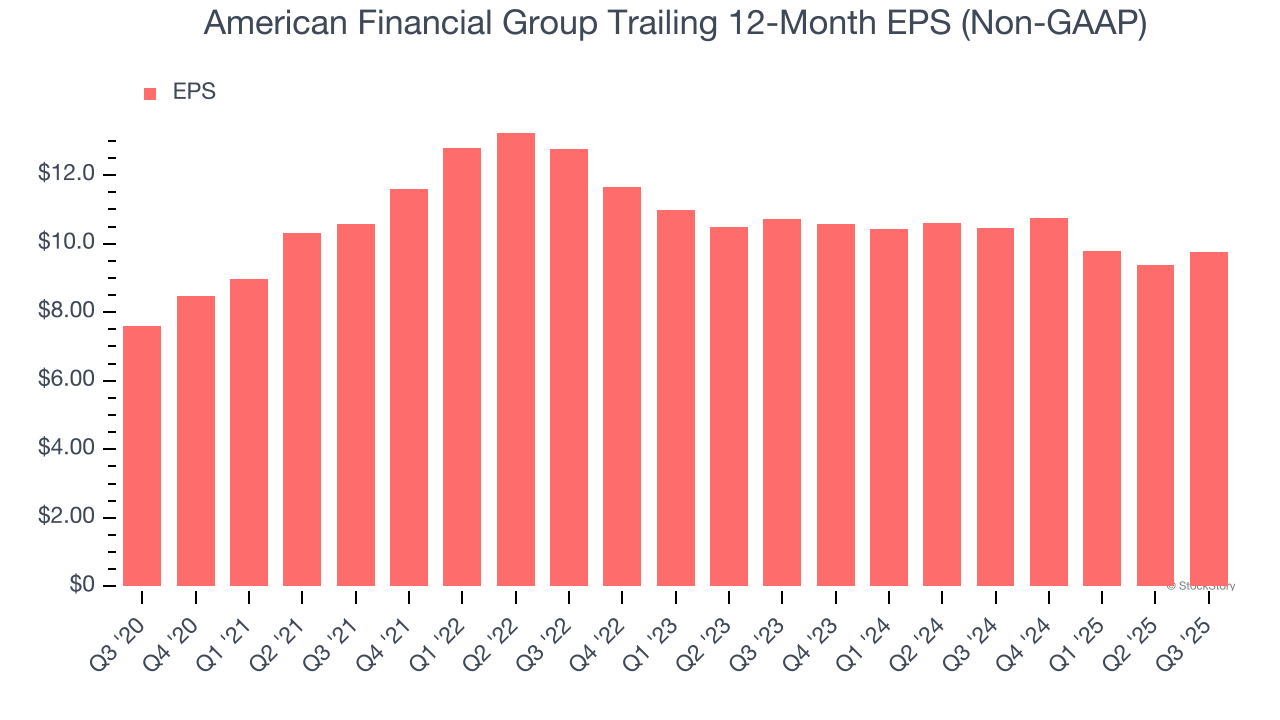
2. EPS Barely Growing
We track the long-term change in earnings per share (EPS) because it highlights whether a company’s growth is profitable.
American Financial Group’s EPS grew at an unimpressive 5.1% compounded annual growth rate over the last five years, lower than its 7.8% annualized revenue growth. This tells us the company became less profitable on a per-share basis as it expanded.
3. Substandard BVPS Growth Indicates Limited Asset Expansion
We consider book value per share (BVPS) a critical metric for insurance companies. BVPS represents the total net worth per share, providing insight into a company’s financial strength and ability to meet policyholder obligations.
To the detriment of investors, American Financial Group’s BVPS grew at a tepid 9.5% annual clip over the last two years.

Final Judgment
American Financial Group isn’t a terrible business, but it doesn’t pass our quality test. That said, the stock currently trades at 2.4× forward P/B (or $137.11 per share). This valuation tells us a lot of optimism is priced in - you can find more timely opportunities elsewhere. We’d recommend looking at the most dominant software business in the world.
Stocks We Like More Than American Financial Group
The market’s up big this year - but there’s a catch. Just 4 stocks account for half the S&P 500’s entire gain. That kind of concentration makes investors nervous, and for good reason. While everyone piles into the same crowded names, smart investors are hunting quality where no one’s looking - and paying a fraction of the price. Check out the high-quality names we’ve flagged in our Top 5 Strong Momentum Stocks for this week. This is a curated list of our High Quality stocks that have generated a market-beating return of 244% over the last five years (as of June 30, 2025).
Stocks that have made our list include now familiar names such as Nvidia (+1,326% between June 2020 and June 2025) as well as under-the-radar businesses like the once-small-cap company Comfort Systems (+782% five-year return). Find your next big winner with StockStory today.
StockStory is growing and hiring equity analyst and marketing roles. Are you a 0 to 1 builder passionate about the markets and AI? See the open roles here.


