Membership-only discount retailer BJ’s Wholesale Club (NYSE: BJ) met Wall Streets revenue expectations in Q3 CY2025, with sales up 4.9% year on year to $5.35 billion. Its non-GAAP profit of $1.16 per share was 6.6% above analysts’ consensus estimates.
Is now the time to buy BJ's? Find out by accessing our full research report, it’s free for active Edge members.
BJ's (BJ) Q3 CY2025 Highlights:
- Revenue: $5.35 billion vs analyst estimates of $5.35 billion (4.9% year-on-year growth, in line)
- Adjusted EPS: $1.16 vs analyst estimates of $1.09 (6.6% beat)
- Adjusted EBITDA: $301.4 million vs analyst estimates of $294.5 million (5.6% margin, 2.4% beat)
- Management raised its full-year Adjusted EPS guidance to $4.35 at the midpoint, a 1.8% increase
- Operating Margin: 4.1%, in line with the same quarter last year
- Free Cash Flow was -$13.74 million, down from $18.82 million in the same quarter last year
- Locations: 257 at quarter end, up from 247 in the same quarter last year
- Same-Store Sales rose 1.1% year on year, in line with the same quarter last year
- Market Capitalization: $11.94 billion
“Our business continues to perform well in a volatile environment and we are maintaining an unwavering focus on what matters most: taking care of families who depend on us,” said Bob Eddy, Chairman and Chief Executive Officer, BJ’s Wholesale Club.
Company Overview
Appealing to the budget-conscious individual shopping for a household, BJ’s Wholesale Club (NYSE: BJ) is a membership-only retail chain that sells groceries, appliances, electronics, and household items, often in bulk quantities.
Revenue Growth
Reviewing a company’s long-term sales performance reveals insights into its quality. Any business can experience short-term success, but top-performing ones enjoy sustained growth for years.
With $21.16 billion in revenue over the past 12 months, BJ's is one of the larger companies in the consumer retail industry and benefits from a well-known brand that influences purchasing decisions. However, its scale is a double-edged sword because there are only a finite number of places to build new stores, making it harder to find incremental growth. For BJ's to boost its sales, it likely needs to adjust its prices or lean into foreign markets.
As you can see below, BJ's grew its sales at a mediocre 8.3% compounded annual growth rate over the last six years (we compare to 2019 to normalize for COVID-19 impacts) as it barely increased sales at existing, established locations.
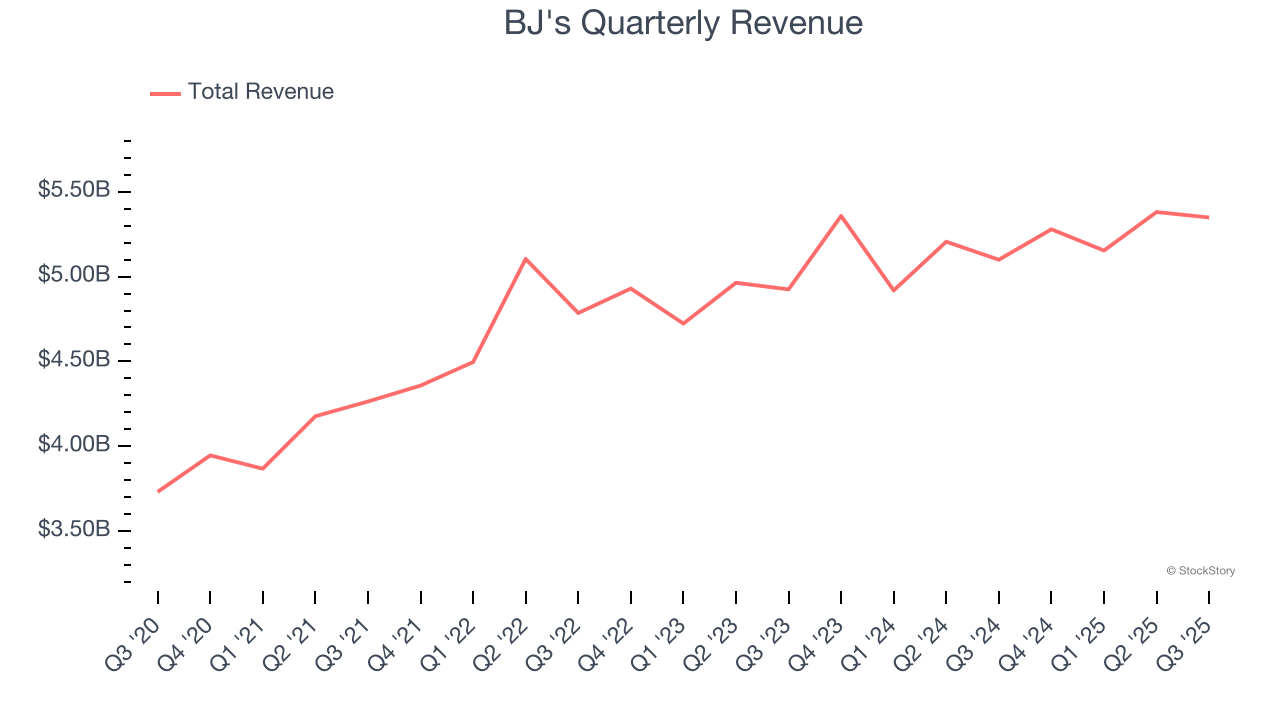
This quarter, BJ's grew its revenue by 4.9% year on year, and its $5.35 billion of revenue was in line with Wall Street’s estimates.
Looking ahead, sell-side analysts expect revenue to grow 6% over the next 12 months, a slight deceleration versus the last six years. We still think its growth trajectory is attractive given its scale and suggests the market is forecasting success for its products.
Microsoft, Alphabet, Coca-Cola, Monster Beverage—all began as under-the-radar growth stories riding a massive trend. We’ve identified the next one: a profitable AI semiconductor play Wall Street is still overlooking. Go here for access to our full report.
Store Performance
Number of Stores
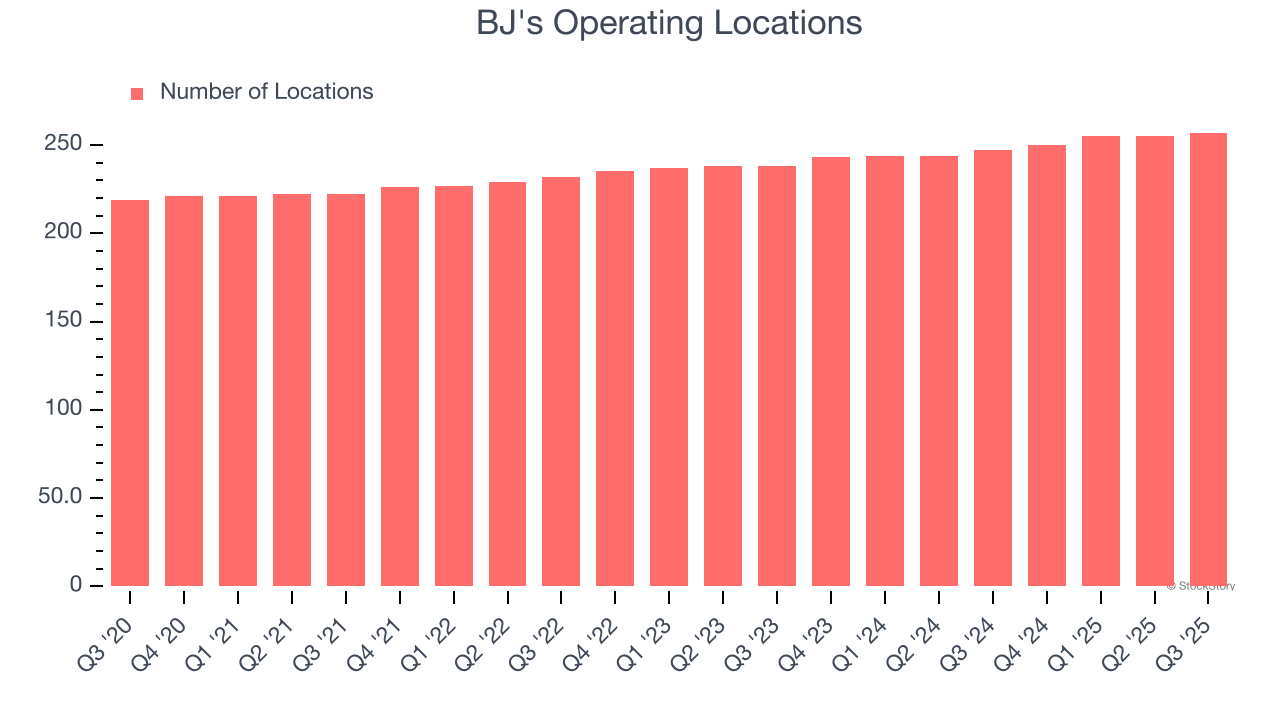
BJ's sported 257 locations in the latest quarter. Over the last two years, it has opened new stores at a rapid clip by averaging 3.6% annual growth, among the fastest in the consumer retail sector.
When a retailer opens new stores, it usually means it’s investing for growth because demand is greater than supply, especially in areas where consumers may not have a store within reasonable driving distance.
Same-Store Sales
The change in a company's store base only tells one side of the story. The other is the performance of its existing locations and e-commerce sales, which informs management teams whether they should expand or downsize their physical footprints. Same-store sales gives us insight into this topic because it measures organic growth for a retailer's e-commerce platform and brick-and-mortar shops that have existed for at least a year.
BJ’s demand within its existing locations has been relatively stable over the last two years but was below most retailers. On average, the company’s same-store sales have grown by 1.6% per year. This performance suggests it should consider improving its foot traffic and efficiency before expanding its store base.
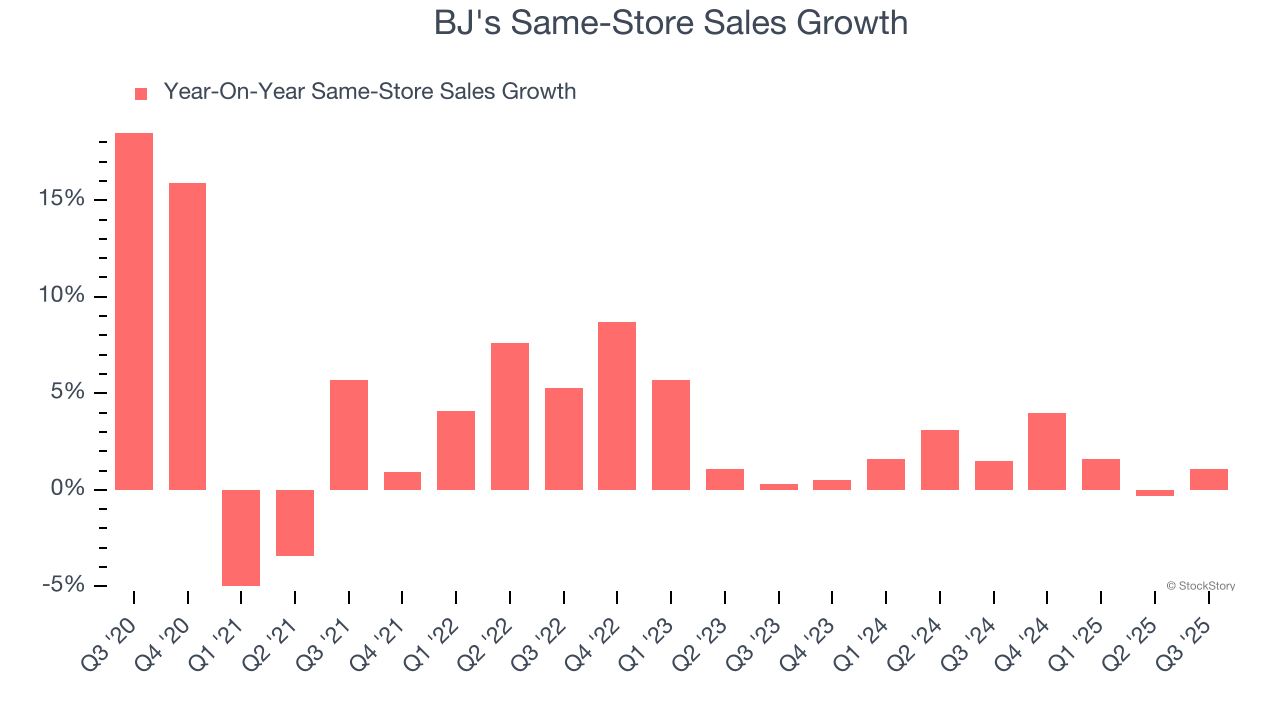
In the latest quarter, BJ’s same-store sales rose 1.1% year on year. This performance was more or less in line with its historical levels.
Key Takeaways from BJ’s Q3 Results
It was encouraging to see BJ's beat analysts’ EPS expectations this quarter despite in-line revenue. That the company slightly raised full-year EPS guidance was also a good sign. Overall, this print had some key positives. The stock remained flat at $91.06 immediately following the results.
Should you buy the stock or not? If you’re making that decision, you should consider the bigger picture of valuation, business qualities, as well as the latest earnings. We cover that in our actionable full research report which you can read here, it’s free for active Edge members.