
IPG Photonics trades at $74.93 and has moved in lockstep with the market. Its shares have returned 11.9% over the last six months while the S&P 500 has gained 10.4%.
Is now the time to buy IPG Photonics, or should you be careful about including it in your portfolio? Dive into our full research report to see our analyst team’s opinion, it’s free for active Edge members.
Why Do We Think IPG Photonics Will Underperform?
We're swiping left on IPG Photonics for now. Here are three reasons you should be careful with IPGP and a stock we'd rather own.
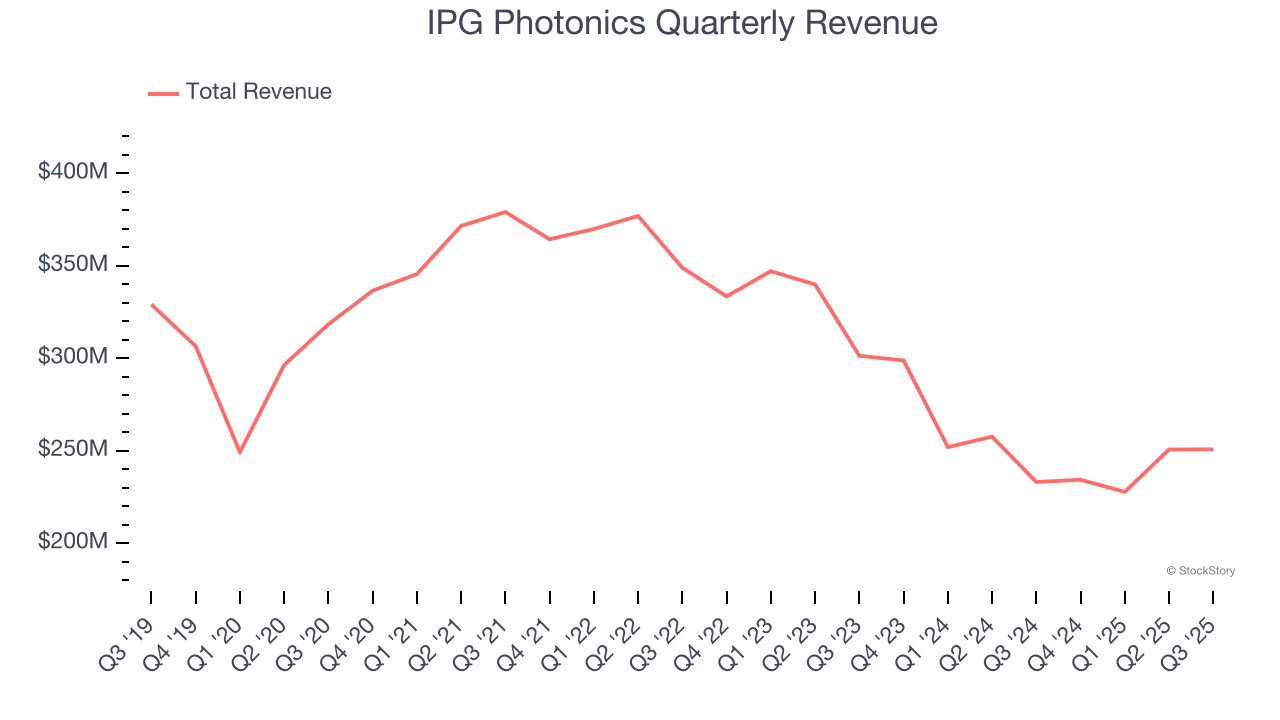
1. Revenue Spiraling Downwards
Examining a company’s long-term performance can provide clues about its quality. Any business can have short-term success, but a top-tier one grows for years. IPG Photonics struggled to consistently generate demand over the last five years as its sales dropped at a 3.8% annual rate. This wasn’t a great result and signals it’s a low quality business. Semiconductors are a cyclical industry, and long-term investors should be prepared for periods of high growth followed by periods of revenue contractions.
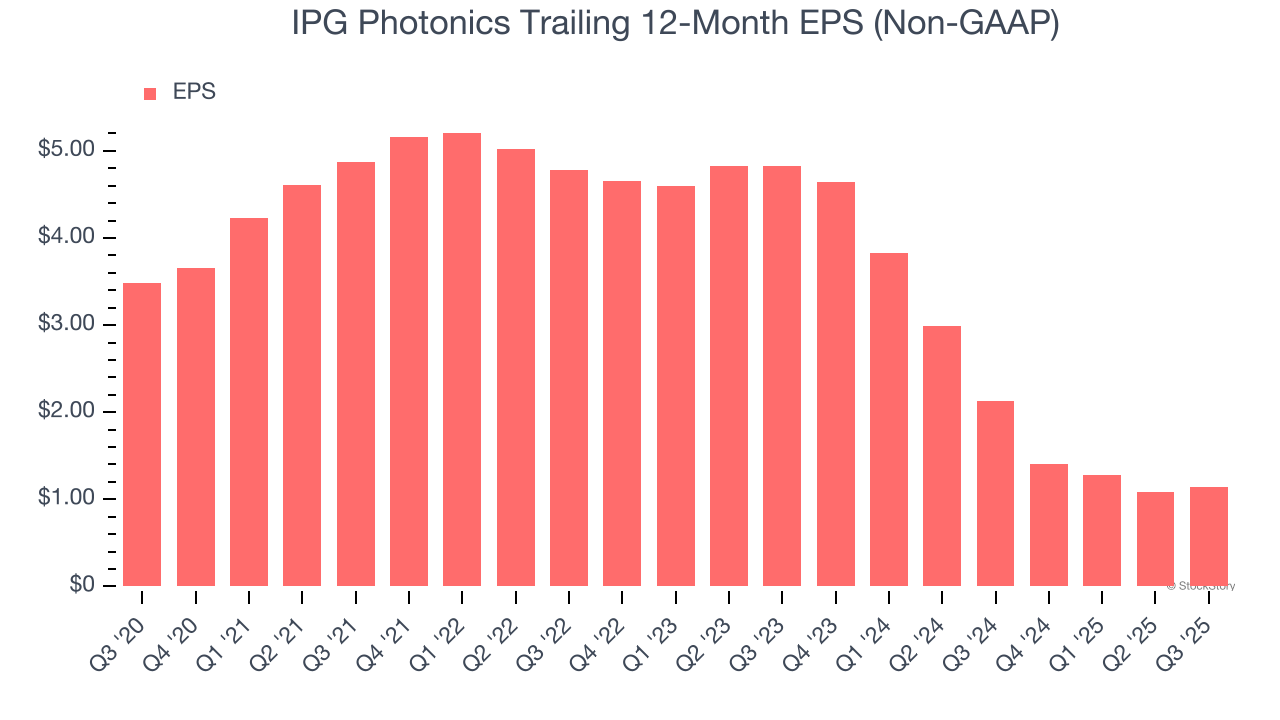
2. EPS Trending Down
We track the long-term change in earnings per share (EPS) because it highlights whether a company’s growth is profitable.
Sadly for IPG Photonics, its EPS declined by 20% annually over the last five years, more than its revenue. This tells us the company struggled because its fixed cost base made it difficult to adjust to shrinking demand.
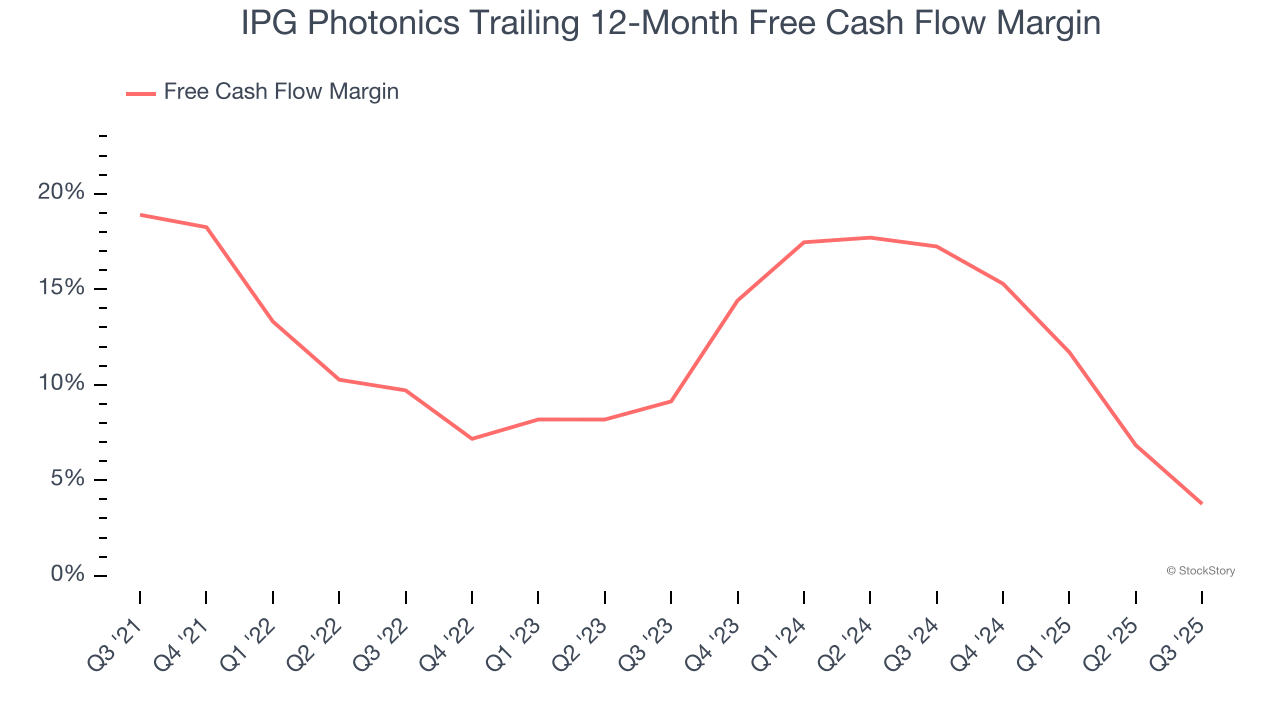
3. Free Cash Flow Margin Dropping
Free cash flow isn't a prominently featured metric in company financials and earnings releases, but we think it's telling because it accounts for all operating and capital expenses, making it tough to manipulate. Cash is king.
As you can see below, IPG Photonics’s margin dropped by 15.1 percentage points over the last five years. This along with its unexciting margin put the company in a tough spot, and shareholders are likely hoping it can reverse course. If the trend continues, it could signal it’s in the middle of a big investment cycle. IPG Photonics’s free cash flow margin for the trailing 12 months was 3.8%.
Final Judgment
We cheer for all companies solving complex technology issues, but in the case of IPG Photonics, we’ll be cheering from the sidelines. That said, the stock currently trades at 53.7× forward P/E (or $74.93 per share). This multiple tells us a lot of good news is priced in - we think other companies feature superior fundamentals at the moment. Let us point you toward a top digital advertising platform riding the creator economy.
Stocks We Like More Than IPG Photonics
Your portfolio can’t afford to be based on yesterday’s story. The risk in a handful of heavily crowded stocks is rising daily.
The names generating the next wave of massive growth are right here in our Top 5 Strong Momentum Stocks for this week. This is a curated list of our High Quality stocks that have generated a market-beating return of 244% over the last five years (as of June 30, 2025).
Stocks that have made our list include now familiar names such as Nvidia (+1,326% between June 2020 and June 2025) as well as under-the-radar businesses like the once-small-cap company Exlservice (+354% five-year return). Find your next big winner with StockStory today.
StockStory is growing and hiring equity analyst and marketing roles. Are you a 0 to 1 builder passionate about the markets and AI? See the open roles here.


