IMAX’s 28.4% return over the past six months has outpaced the S&P 500 by 18%, and its stock price has climbed to $36.07 per share. This was partly due to its solid quarterly results, and the run-up might have investors contemplating their next move.
Is now the time to buy IMAX, or should you be careful about including it in your portfolio? Get the full breakdown from our expert analysts, it’s free for active Edge members.
Why Is IMAX Not Exciting?
Despite the momentum, we don't have much confidence in IMAX. Here are three reasons why IMAX doesn't excite us and a stock we'd rather own.
1. Revenue Tumbling Downwards
We at StockStory place the most emphasis on long-term growth, but within business services, a stretched historical view may miss recent innovations or disruptive industry trends. IMAX’s recent performance marks a sharp pivot from its five-year trend as its revenue has shown annualized declines of 1.2% over the last two years. 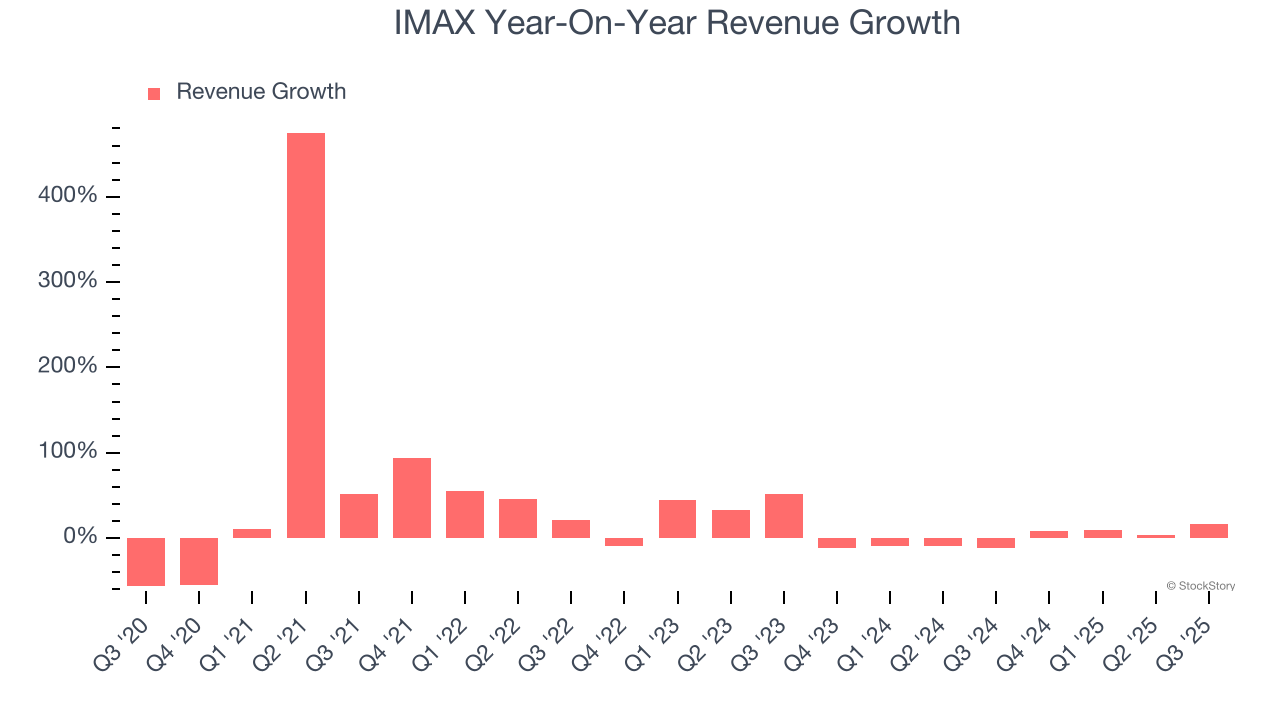
2. Fewer Distribution Channels Limit its Ceiling
With $377.7 million in revenue over the past 12 months, IMAX is a small player in the business services space, which sometimes brings disadvantages compared to larger competitors benefiting from economies of scale and numerous distribution channels. On the bright side, it can grow faster because it has more room to expand.
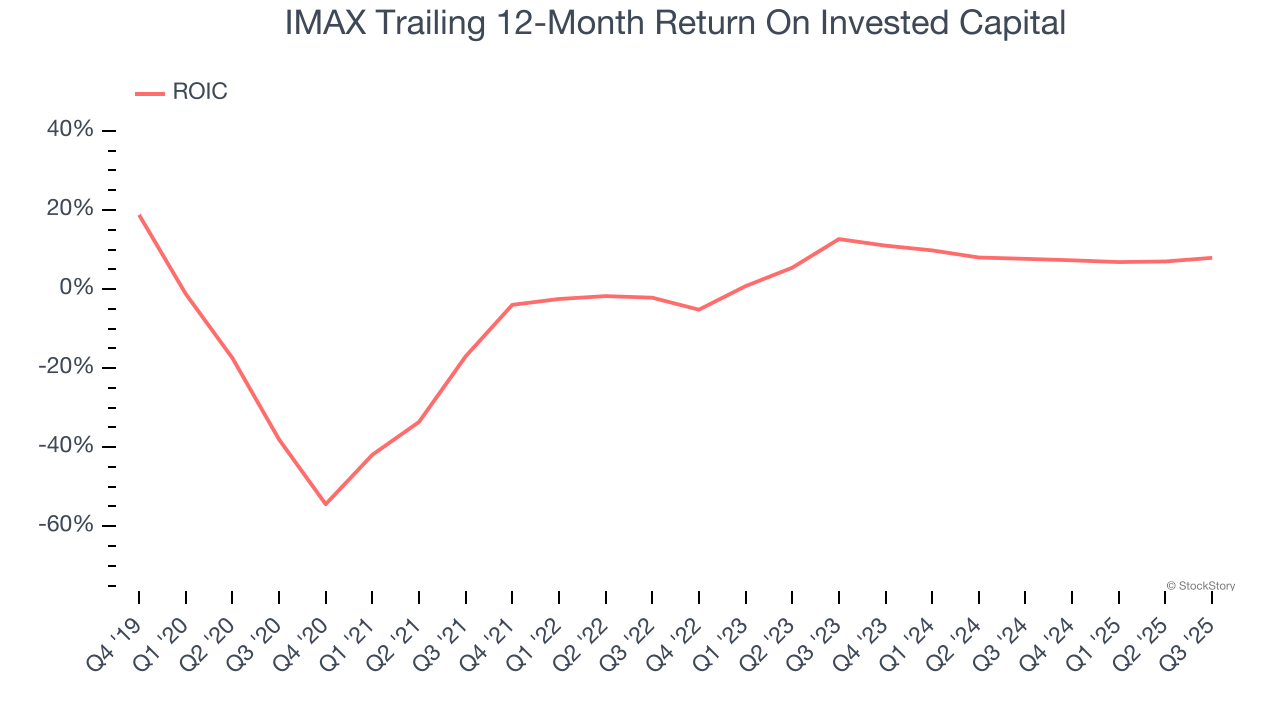
3. Previous Growth Initiatives Haven’t Impressed
Growth gives us insight into a company’s long-term potential, but how capital-efficient was that growth? A company’s ROIC explains this by showing how much operating profit it makes compared to the money it has raised (debt and equity).
IMAX historically did a mediocre job investing in profitable growth initiatives. Its five-year average ROIC was 1.8%, lower than the typical cost of capital (how much it costs to raise money) for business services companies.
Final Judgment
IMAX isn’t a terrible business, but it doesn’t pass our quality test. With its shares beating the market recently, the stock trades at 23.9× forward P/E (or $36.07 per share). Beauty is in the eye of the beholder, but we don’t really see a big opportunity at the moment. We're fairly confident there are better investments elsewhere. We’d recommend looking at one of Charlie Munger’s all-time favorite businesses.
High-Quality Stocks for All Market Conditions
If your portfolio success hinges on just 4 stocks, your wealth is built on fragile ground. You have a small window to secure high-quality assets before the market widens and these prices disappear.
Don’t wait for the next volatility shock. Check out our Top 5 Growth Stocks for this month. This is a curated list of our High Quality stocks that have generated a market-beating return of 244% over the last five years (as of June 30, 2025).
Stocks that have made our list include now familiar names such as Nvidia (+1,326% between June 2020 and June 2025) as well as under-the-radar businesses like the once-micro-cap company Kadant (+351% five-year return). Find your next big winner with StockStory today.
StockStory is growing and hiring equity analyst and marketing roles. Are you a 0 to 1 builder passionate about the markets and AI? See the open roles here.


