
3D design software company Autodesk (NASDAQ: ADSK) reported Q3 CY2025 results topping the market’s revenue expectations, with sales up 18% year on year to $1.85 billion. Guidance for next quarter’s revenue was optimistic at $1.91 billion at the midpoint, 2.6% above analysts’ estimates. Its non-GAAP profit of $2.67 per share was 6.9% above analysts’ consensus estimates.
Is now the time to buy Autodesk? Find out by accessing our full research report, it’s free for active Edge members.
Autodesk (ADSK) Q3 CY2025 Highlights:
- Revenue: $1.85 billion vs analyst estimates of $1.81 billion (18% year-on-year growth, 2.4% beat)
- Adjusted EPS: $2.67 vs analyst estimates of $2.50 (6.9% beat)
- Revenue Guidance for Q4 CY2025 is $1.91 billion at the midpoint, above analyst estimates of $1.86 billion
- Management raised its full-year Adjusted EPS guidance to $10.22 at the midpoint, a 3.3% increase
- Operating Margin: 25.4%, up from 22% in the same quarter last year
- Free Cash Flow Margin: 23.2%, down from 25.6% in the previous quarter
- Billings: $1.86 billion at quarter end, up 20.8% year on year
- Market Capitalization: $61.67 billion
"We're defining the AI revolution for design and make, empowering customers with new task, workflow and system automations, and capturing shared value through subscription, consumption, and outcomes-based business models that blend human and machine capabilities," said Andrew Anagnost, Autodesk president and CEO.
Company Overview
Starting with AutoCAD in the 1980s and evolving into a comprehensive design ecosystem, Autodesk (NASDAQ: ADSK) provides software solutions for architecture, engineering, construction, manufacturing, and entertainment industries to design, simulate, and visualize projects.
Revenue Growth
A company’s long-term performance is an indicator of its overall quality. Any business can put up a good quarter or two, but many enduring ones grow for years. Over the last five years, Autodesk grew its sales at a 13.5% compounded annual growth rate. Although this growth is acceptable on an absolute basis, it fell short of our standards for the software sector, which enjoys a number of secular tailwinds.
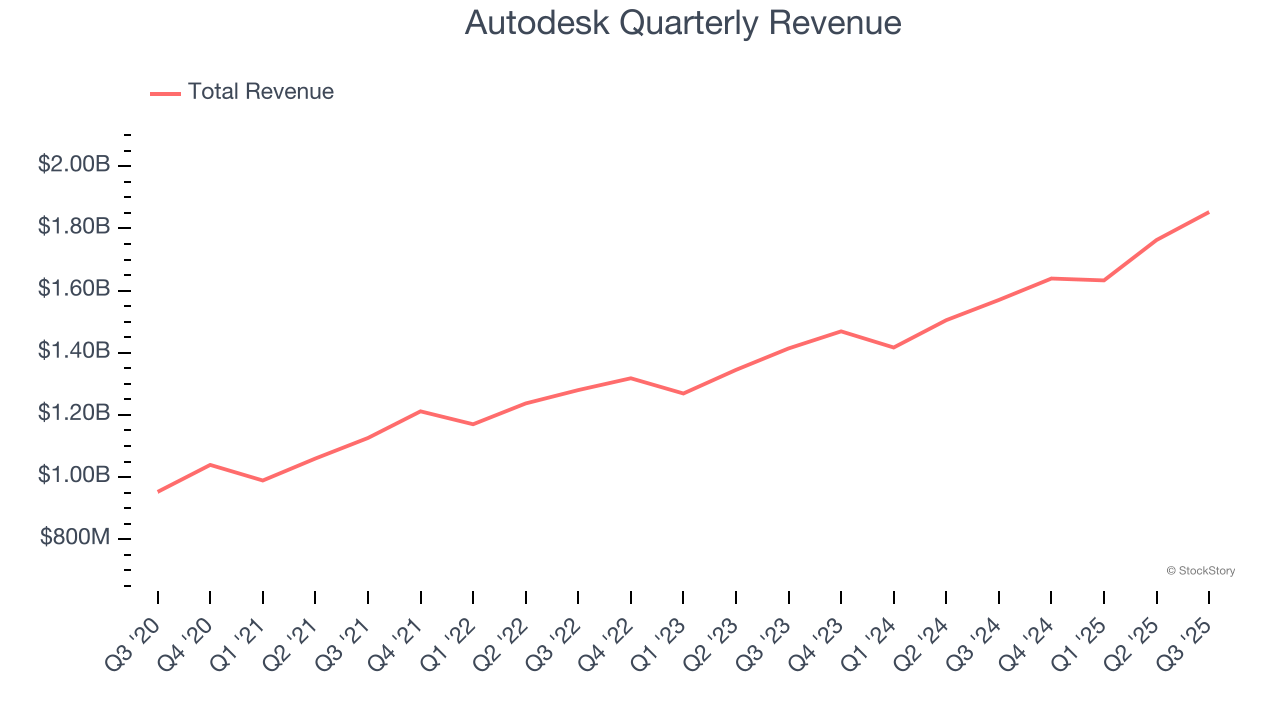
Long-term growth is the most important, but within software, a half-decade historical view may miss new innovations or demand cycles. Autodesk’s annualized revenue growth of 13.5% over the last two years aligns with its five-year trend, suggesting its demand was consistently weak. 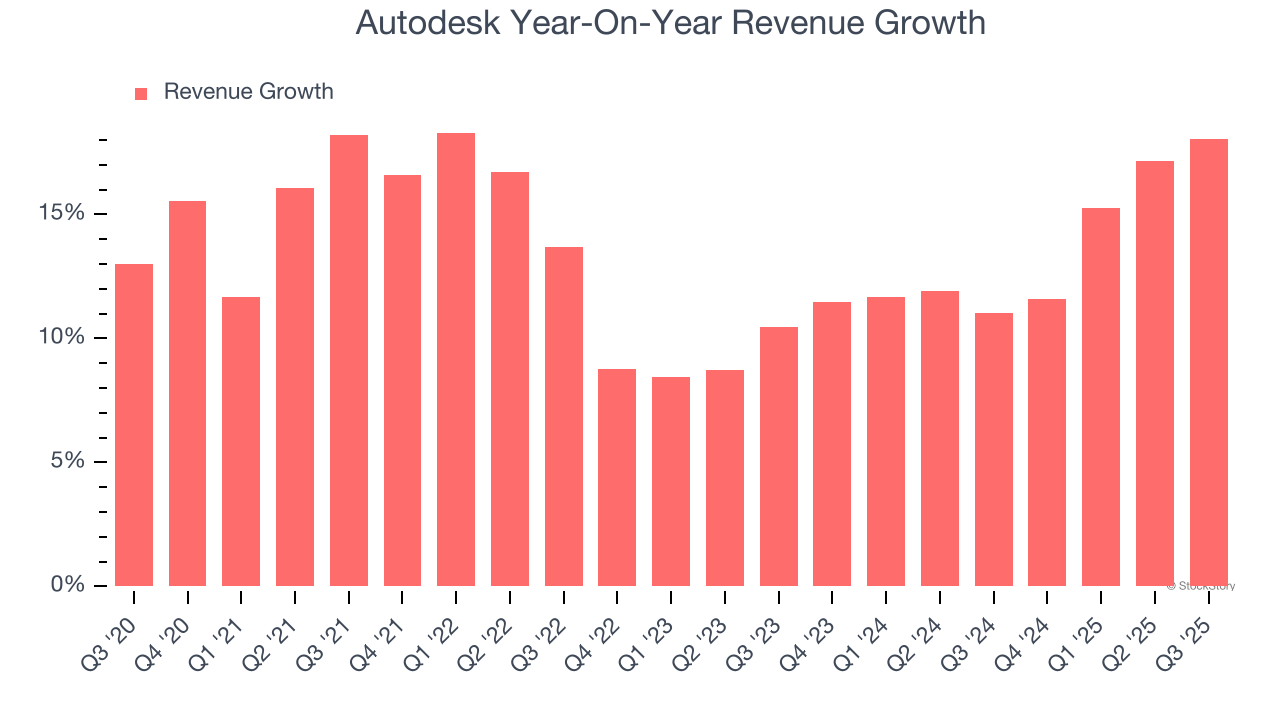
This quarter, Autodesk reported year-on-year revenue growth of 18%, and its $1.85 billion of revenue exceeded Wall Street’s estimates by 2.4%. Company management is currently guiding for a 16.5% year-on-year increase in sales next quarter.
Looking further ahead, sell-side analysts expect revenue to grow 11% over the next 12 months, a slight deceleration versus the last two years. This projection doesn't excite us and indicates its products and services will face some demand challenges.
While Wall Street chases Nvidia at all-time highs, an under-the-radar semiconductor supplier is dominating a critical AI component these giants can’t build without. Click here to access our free report one of our favorites growth stories.
Billings
Billings is a non-GAAP metric that is often called “cash revenue” because it shows how much money the company has collected from customers in a certain period. This is different from revenue, which must be recognized in pieces over the length of a contract.
Autodesk’s billings punched in at $1.86 billion in Q3, and over the last four quarters, its growth was fantastic as it averaged 27.1% year-on-year increases. This alternate topline metric grew faster than total sales, meaning the company collects cash upfront and then recognizes the revenue over the length of its contracts - a boost for its liquidity and future revenue prospects. 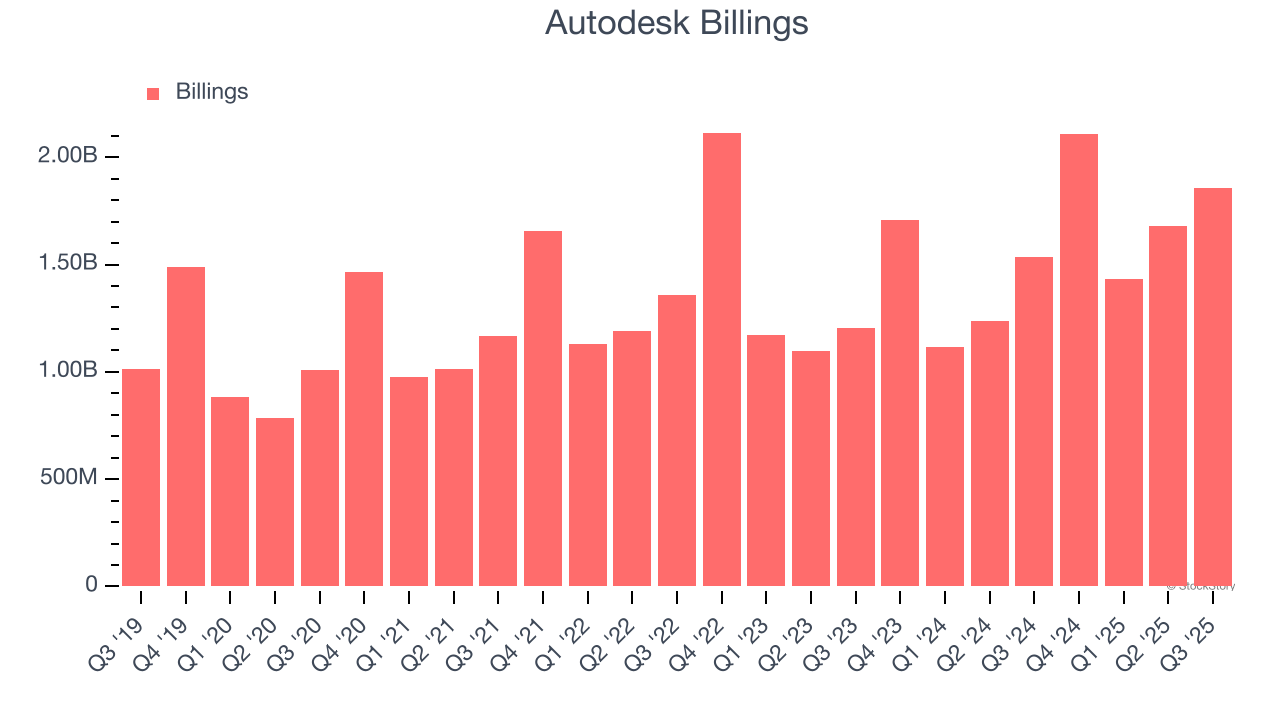
Customer Acquisition Efficiency
The customer acquisition cost (CAC) payback period measures the months a company needs to recoup the money spent on acquiring a new customer. This metric helps assess how quickly a business can break even on its sales and marketing investments.
Autodesk’s recent customer acquisition efforts haven’t yielded returns as its CAC payback period was negative this quarter, meaning its incremental sales and marketing investments outpaced its revenue. The company’s inefficiency indicates it operates in a competitive market and must continue investing to grow.
Key Takeaways from Autodesk’s Q3 Results
It was great to see Autodesk’s full-year EPS guidance top analysts’ expectations. We were also glad its EPS guidance for next quarter exceeded Wall Street’s estimates. Overall, we think this was a solid quarter with some key areas of upside. The stock traded up 3.1% to $303.56 immediately following the results.
Autodesk put up rock-solid earnings, but one quarter doesn’t necessarily make the stock a buy. Let’s see if this is a good investment. The latest quarter does matter, but not nearly as much as longer-term fundamentals and valuation, when deciding if the stock is a buy. We cover that in our actionable full research report which you can read here, it’s free for active Edge members.


