
Digital operations platform PagerDuty (NYSE: PD) met Wall Streets revenue expectations in Q3 CY2025, with sales up 4.7% year on year to $124.5 million. On the other hand, next quarter’s revenue guidance of $123 million was less impressive, coming in 3.4% below analysts’ estimates. Its non-GAAP profit of $0.33 per share was 35% above analysts’ consensus estimates.
Is now the time to buy PagerDuty? Find out by accessing our full research report, it’s free for active Edge members.
PagerDuty (PD) Q3 CY2025 Highlights:
- Revenue: $124.5 million vs analyst estimates of $125 million (4.7% year-on-year growth, in line)
- Adjusted EPS: $0.33 vs analyst estimates of $0.24 (35% beat)
- Adjusted Operating Income: $35.55 million vs analyst estimates of $26.08 million (28.5% margin, 36.3% beat)
- Revenue Guidance for Q4 CY2025 is $123 million at the midpoint, below analyst estimates of $127.4 million
- Management raised its full-year Adjusted EPS guidance to $1.12 at the midpoint, a 9.3% increase
- Operating Margin: 6.5%, up from -8.7% in the same quarter last year
- Free Cash Flow Margin: 16.8%, down from 24.5% in the previous quarter
- Customers: 15,398, up from 15,322 in the previous quarter
- Billings: $117.8 million at quarter end, in line with the same quarter last year
- Market Capitalization: $1.39 billion
Company Overview
Born from the frustration of developers being woken up by unprioritized alerts, PagerDuty (NYSE: PD) is a digital operations management platform that helps organizations detect and respond to IT incidents, outages, and other critical issues in real-time.
Revenue Growth
Examining a company’s long-term performance can provide clues about its quality. Any business can put up a good quarter or two, but many enduring ones grow for years. Luckily, PagerDuty’s sales grew at a decent 19.6% compounded annual growth rate over the last five years. Its growth was slightly above the average software company and shows its offerings resonate with customers.
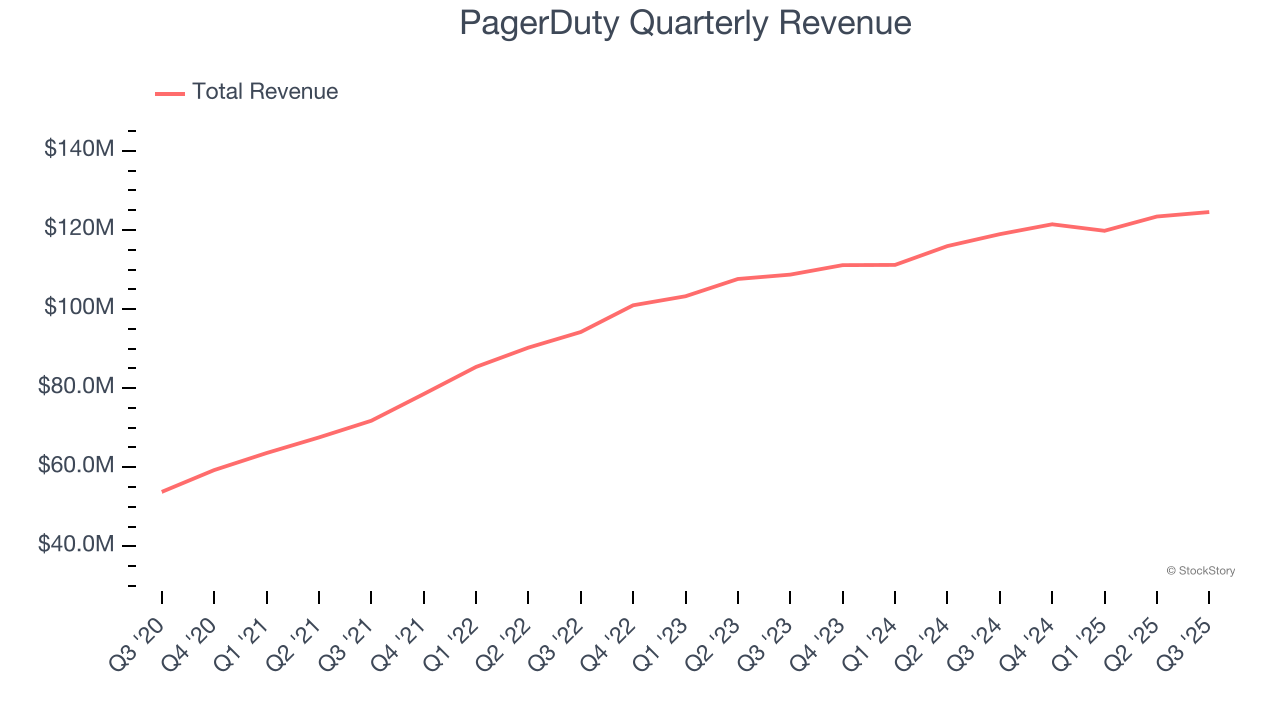
Long-term growth is the most important, but within software, a half-decade historical view may miss new innovations or demand cycles. PagerDuty’s recent performance shows its demand has slowed as its annualized revenue growth of 7.9% over the last two years was below its five-year trend. 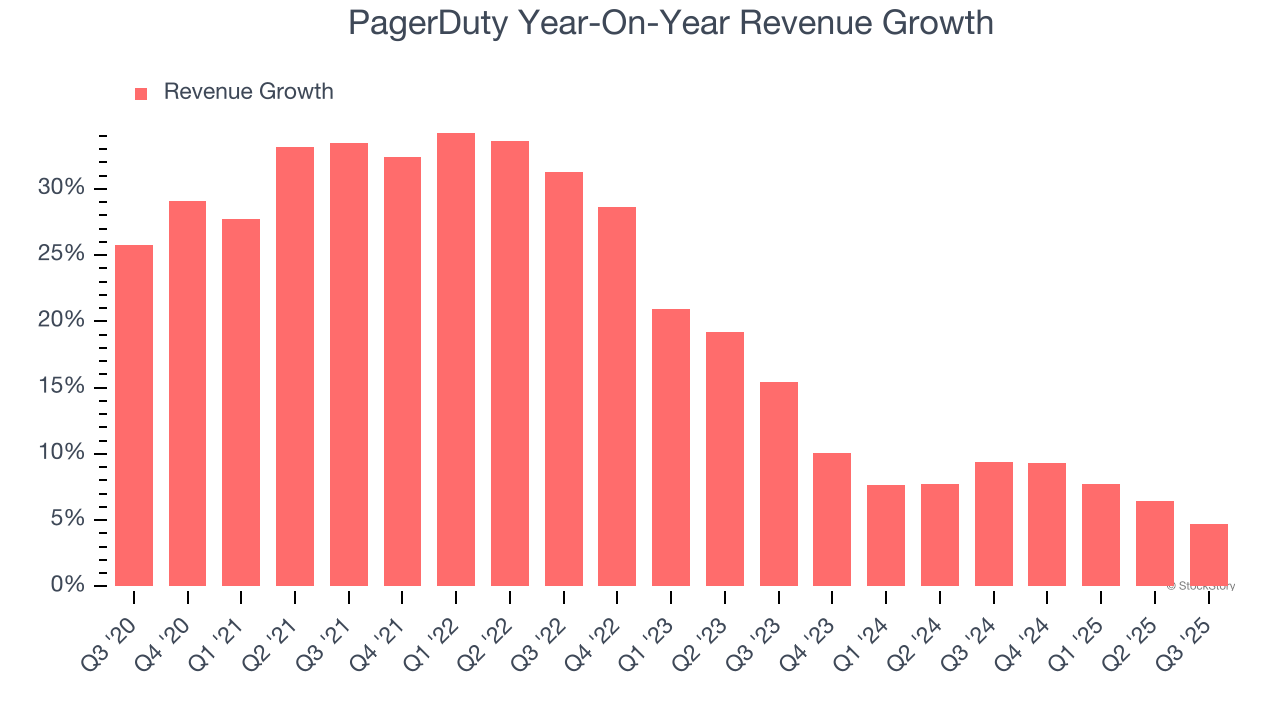
This quarter, PagerDuty grew its revenue by 4.7% year on year, and its $124.5 million of revenue was in line with Wall Street’s estimates. Company management is currently guiding for a 1.3% year-on-year increase in sales next quarter.
Looking further ahead, sell-side analysts expect revenue to grow 6.4% over the next 12 months, similar to its two-year rate. This projection doesn't excite us and indicates its products and services will face some demand challenges.
The 1999 book Gorilla Game predicted Microsoft and Apple would dominate tech before it happened. Its thesis? Identify the platform winners early. Today, enterprise software companies embedding generative AI are becoming the new gorillas. a profitable, fast-growing enterprise software stock that is already riding the automation wave and looking to catch the generative AI next.
Billings
Billings is a non-GAAP metric that is often called “cash revenue” because it shows how much money the company has collected from customers in a certain period. This is different from revenue, which must be recognized in pieces over the length of a contract.
PagerDuty’s billings came in at $117.8 million in Q3, and over the last four quarters, its growth was underwhelming as it averaged 3.8% year-on-year increases. This alternate topline metric grew slower than total sales, meaning the company recognizes revenue faster than it collects cash - a headwind for its liquidity that could also signal a slowdown in future revenue growth. 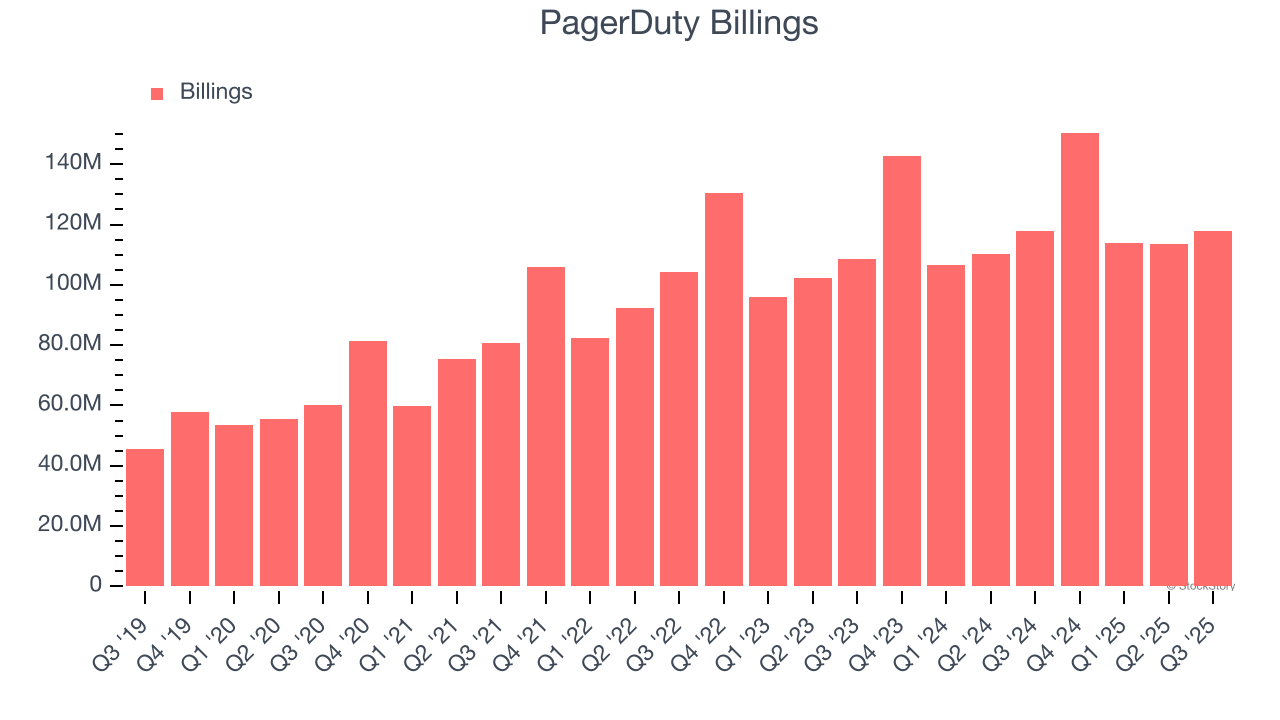
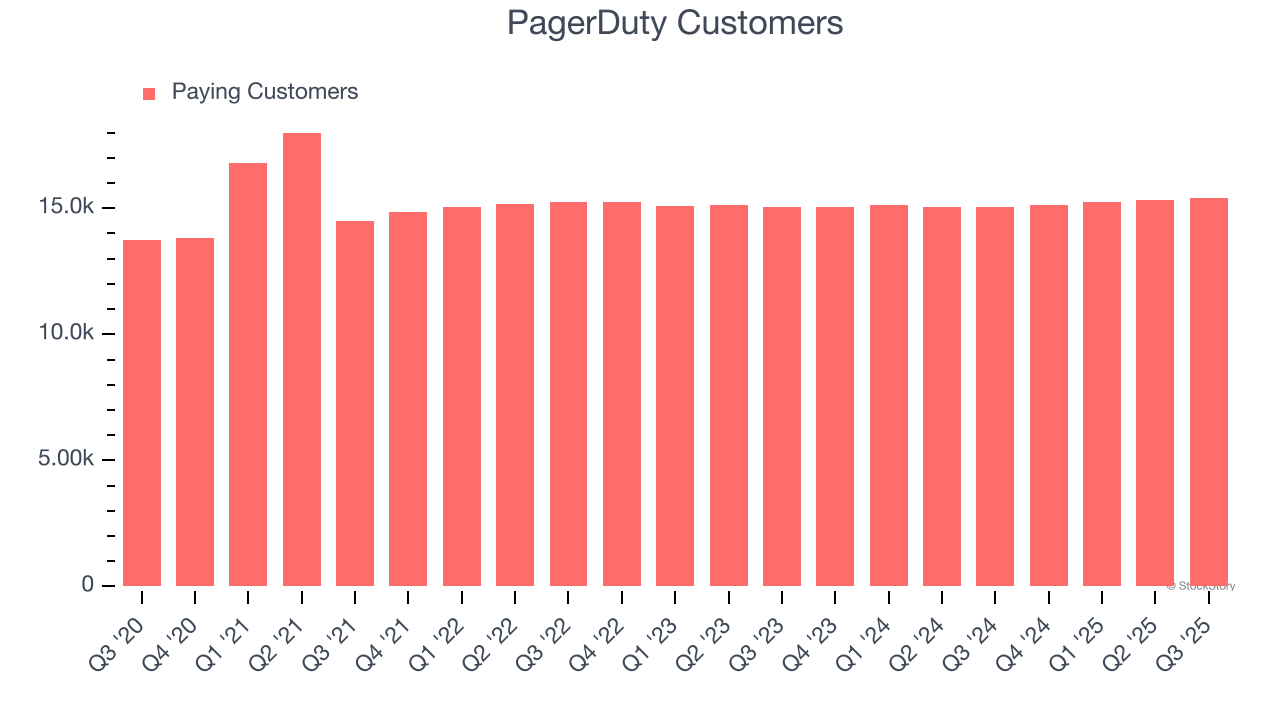
Customer Base
PagerDuty reported 15,398 customers at the end of the quarter, a sequential increase of 76. That’s roughly in line with what we’ve observed over the last year.
Key Takeaways from PagerDuty’s Q3 Results
We were impressed by PagerDuty’s optimistic full-year EPS guidance, which blew past analysts’ expectations. We were also glad its EPS guidance for next quarter exceeded Wall Street’s estimates. On the other hand, its full-year revenue guidance slightly missed and its revenue guidance for next quarter fell short of Wall Street’s estimates. Overall, this was a weaker quarter. The stock traded down 7.2% to $14.10 immediately following the results.
PagerDuty underperformed this quarter, but does that create an opportunity to invest right now? What happened in the latest quarter matters, but not as much as longer-term business quality and valuation, when deciding whether to invest in this stock. We cover that in our actionable full research report which you can read here, it’s free for active Edge members.


