
What a brutal six months it’s been for ManpowerGroup. The stock has dropped 33.8% and now trades at $28.32, rattling many shareholders. This may have investors wondering how to approach the situation.
Is there a buying opportunity in ManpowerGroup, or does it present a risk to your portfolio? Check out our in-depth research report to see what our analysts have to say, it’s free for active Edge members.
Why Do We Think ManpowerGroup Will Underperform?
Despite the more favorable entry price, we're sitting this one out for now. Here are three reasons why MAN doesn't excite us and a stock we'd rather own.
1. Core Business Falling Behind as Demand Declines
In addition to reported revenue, organic revenue is a useful data point for analyzing Professional Staffing & HR Solutions companies. This metric gives visibility into ManpowerGroup’s core business because it excludes one-time events such as mergers, acquisitions, and divestitures along with foreign currency fluctuations - non-fundamental factors that can manipulate the income statement.
Over the last two years, ManpowerGroup’s organic revenue averaged 2.4% year-on-year declines. This performance was underwhelming and implies it may need to improve its products, pricing, or go-to-market strategy. It also suggests ManpowerGroup might have to lean into acquisitions to grow, which isn’t ideal because M&A can be expensive and risky (integrations often disrupt focus). 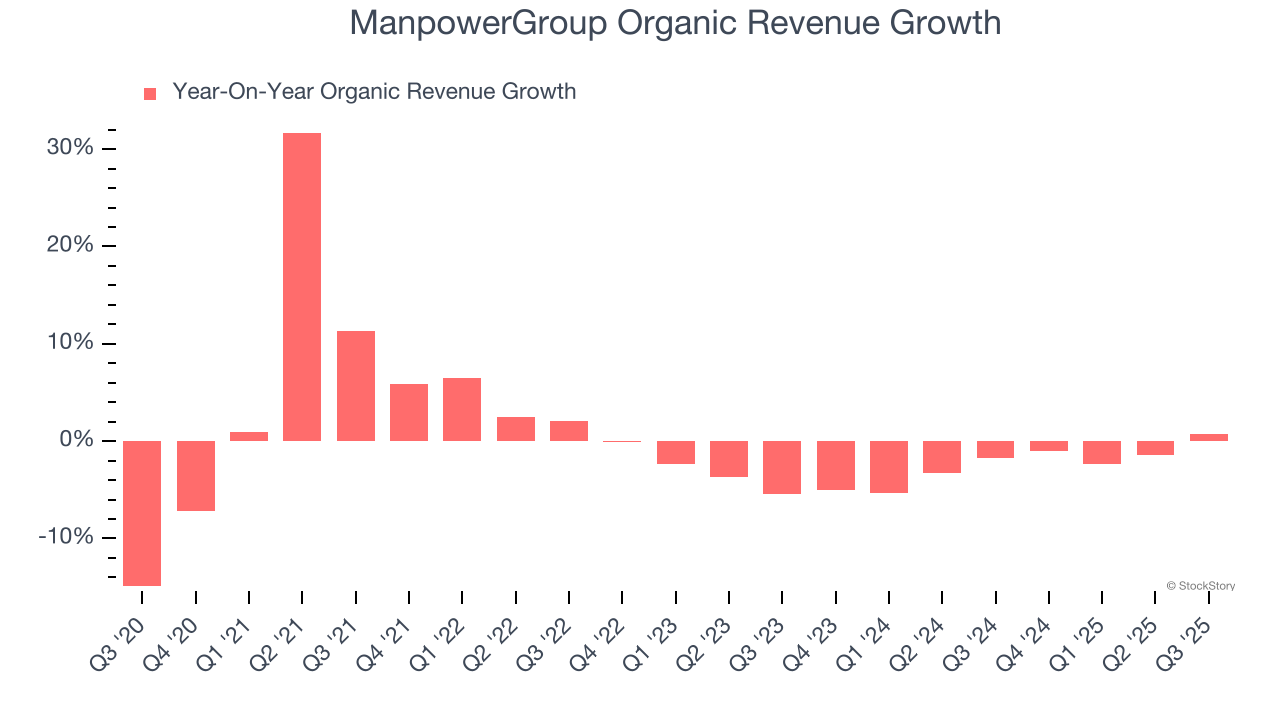
2. EPS Trending Down
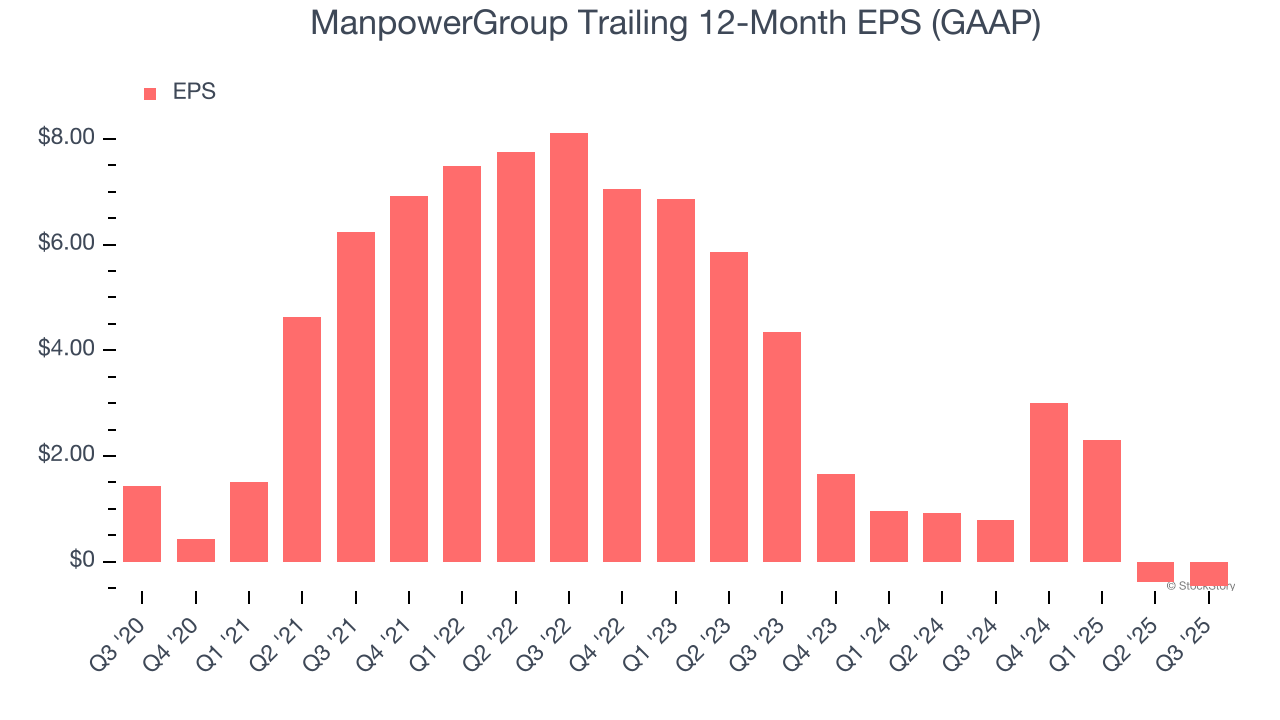
We track the long-term change in earnings per share (EPS) because it highlights whether a company’s growth is profitable.
Sadly for ManpowerGroup, its EPS declined by 18.4% annually over the last five years while its revenue was flat. This tells us the company struggled because its fixed cost base made it difficult to adjust to choppy demand.
3. New Investments Fail to Bear Fruit as ROIC Declines
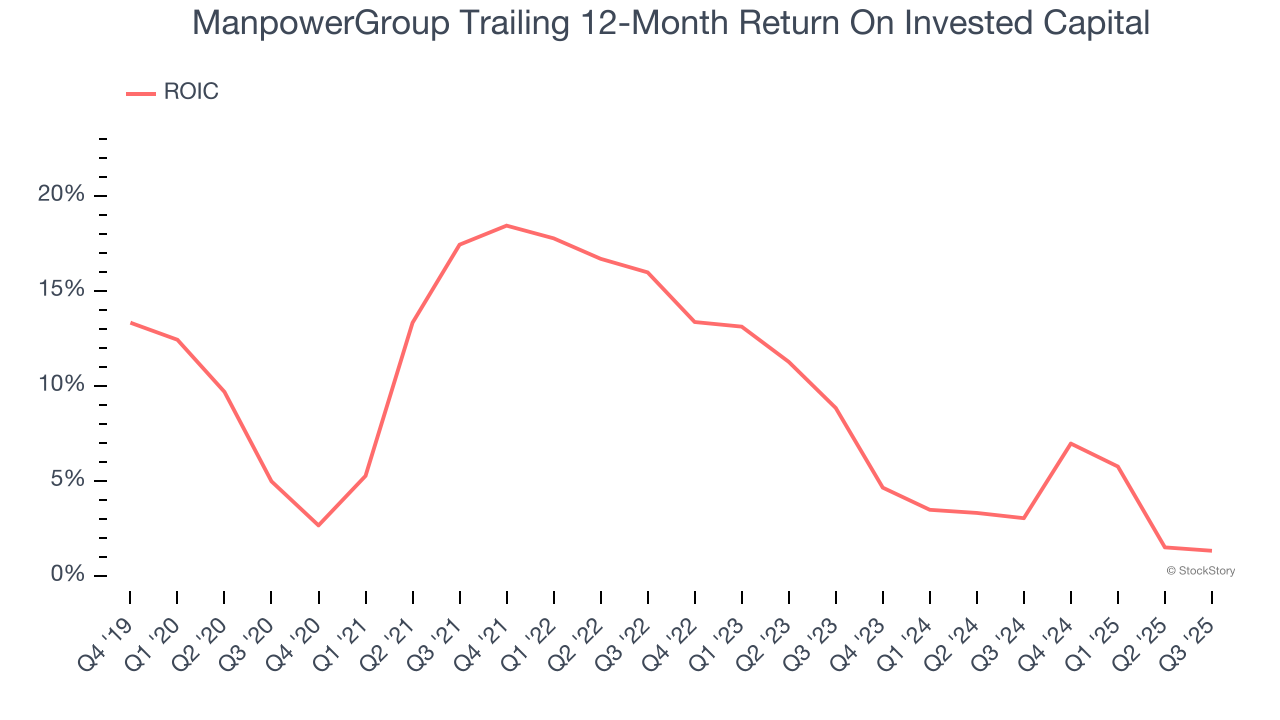
ROIC, or return on invested capital, is a metric showing how much operating profit a company generates relative to the money it has raised (debt and equity).
We like to invest in businesses with high returns, but the trend in a company’s ROIC is what often surprises the market and moves the stock price. Unfortunately, ManpowerGroup’s ROIC has decreased significantly over the last few years. Paired with its already low returns, these declines suggest its profitable growth opportunities are few and far between.
Final Judgment
ManpowerGroup doesn’t pass our quality test. Following the recent decline, the stock trades at 8.1× forward P/E (or $28.32 per share). While this valuation is optically cheap, the potential downside is huge given its shaky fundamentals. There are superior stocks to buy right now. We’d recommend looking at one of our top digital advertising picks.
Stocks We Would Buy Instead of ManpowerGroup
Your portfolio can’t afford to be based on yesterday’s story. The risk in a handful of heavily crowded stocks is rising daily.
The names generating the next wave of massive growth are right here in our Top 9 Market-Beating Stocks. This is a curated list of our High Quality stocks that have generated a market-beating return of 244% over the last five years (as of June 30, 2025).
Stocks that have made our list include now familiar names such as Nvidia (+1,326% between June 2020 and June 2025) as well as under-the-radar businesses like the once-small-cap company Comfort Systems (+782% five-year return). Find your next big winner with StockStory today.
StockStory is growing and hiring equity analyst and marketing roles. Are you a 0 to 1 builder passionate about the markets and AI? See the open roles here.


