
Latham has had an impressive run over the past six months as its shares have beaten the S&P 500 by 6.4%. The stock now trades at $7.10, marking a 19.5% gain. This performance may have investors wondering how to approach the situation.
Is there a buying opportunity in Latham, or does it present a risk to your portfolio? Get the full breakdown from our expert analysts, it’s free for active Edge members.
Why Do We Think Latham Will Underperform?
We’re glad investors have benefited from the price increase, but we're sitting this one out for now. Here are three reasons you should be careful with SWIM and a stock we'd rather own.
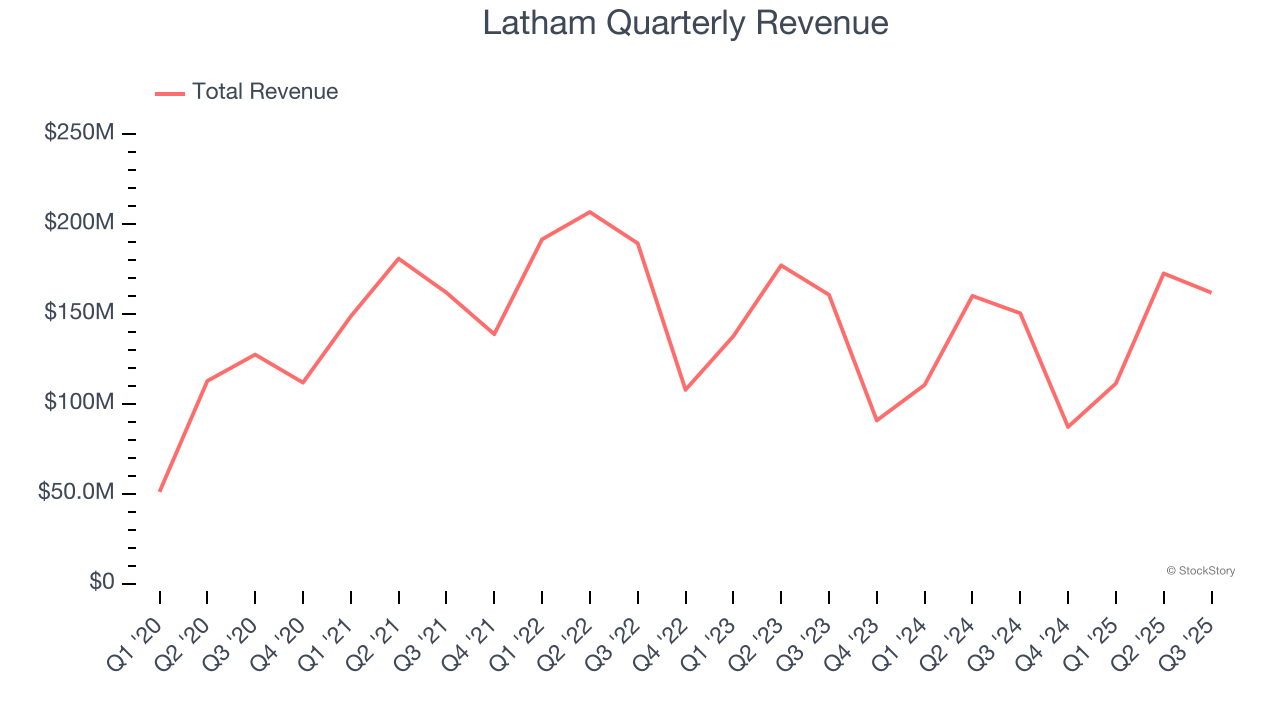
1. Long-Term Revenue Growth Disappoints
A company’s long-term performance is an indicator of its overall quality. Any business can have short-term success, but a top-tier one grows for years. Over the last five years, Latham grew its sales at a weak 8.9% compounded annual growth rate. This fell short of our benchmark for the consumer discretionary sector.
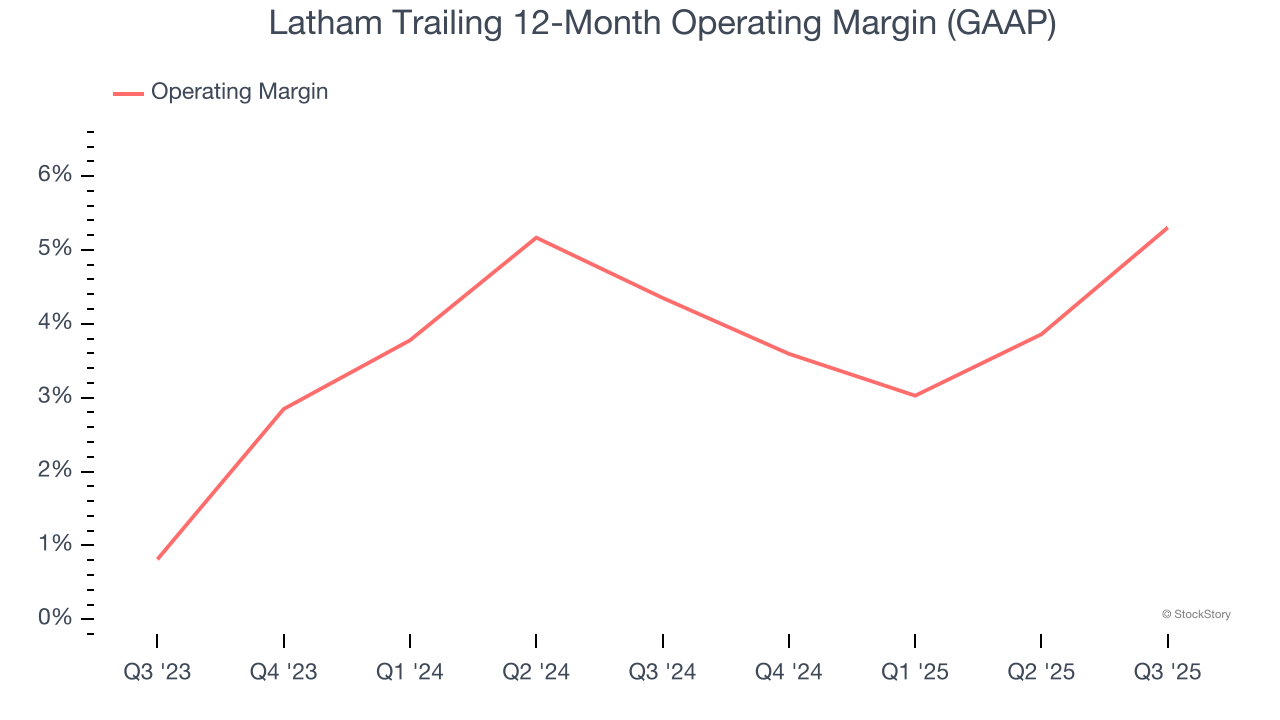
2. Weak Operating Margin Could Cause Trouble
Operating margin is a key measure of profitability. Think of it as net income - the bottom line - excluding the impact of taxes and interest on debt, which are less connected to business fundamentals.
Latham’s operating margin might fluctuated slightly over the last 12 months but has generally stayed the same, averaging 4.8% over the last two years. This profitability was inadequate for a consumer discretionary business and caused by its suboptimal cost structure.
3. Cash Flow Margin Set to Decline
Free cash flow isn't a prominently featured metric in company financials and earnings releases, but we think it's telling because it accounts for all operating and capital expenses, making it tough to manipulate. Cash is king.
Over the next year, analysts predict Latham’s cash conversion will slightly fall. Their consensus estimates imply its free cash flow margin of 4.5% for the last 12 months will decrease to 3.8%.
Final Judgment
Latham doesn’t pass our quality test. With its shares beating the market recently, the stock trades at 40.5× forward P/E (or $7.10 per share). This multiple tells us a lot of good news is priced in - we think there are better opportunities elsewhere. We’d recommend looking at a top digital advertising platform riding the creator economy.
High-Quality Stocks for All Market Conditions
Your portfolio can’t afford to be based on yesterday’s story. The risk in a handful of heavily crowded stocks is rising daily.
The names generating the next wave of massive growth are right here in our Top 5 Strong Momentum Stocks for this week. This is a curated list of our High Quality stocks that have generated a market-beating return of 244% over the last five years (as of June 30, 2025).
Stocks that have made our list include now familiar names such as Nvidia (+1,326% between June 2020 and June 2025) as well as under-the-radar businesses like the once-micro-cap company Kadant (+351% five-year return). Find your next big winner with StockStory today.
StockStory is growing and hiring equity analyst and marketing roles. Are you a 0 to 1 builder passionate about the markets and AI? See the open roles here.


