
Since May 2025, Merchants Bancorp has been in a holding pattern, posting a small return of 0.8% while floating around $32.82. The stock also fell short of the S&P 500’s 15.6% gain during that period.
Is there a buying opportunity in Merchants Bancorp, or does it present a risk to your portfolio? Check out our in-depth research report to see what our analysts have to say, it’s free for active Edge members.
Why Is Merchants Bancorp Not Exciting?
We don't have much confidence in Merchants Bancorp. Here are three reasons we avoid MBIN and a stock we'd rather own.
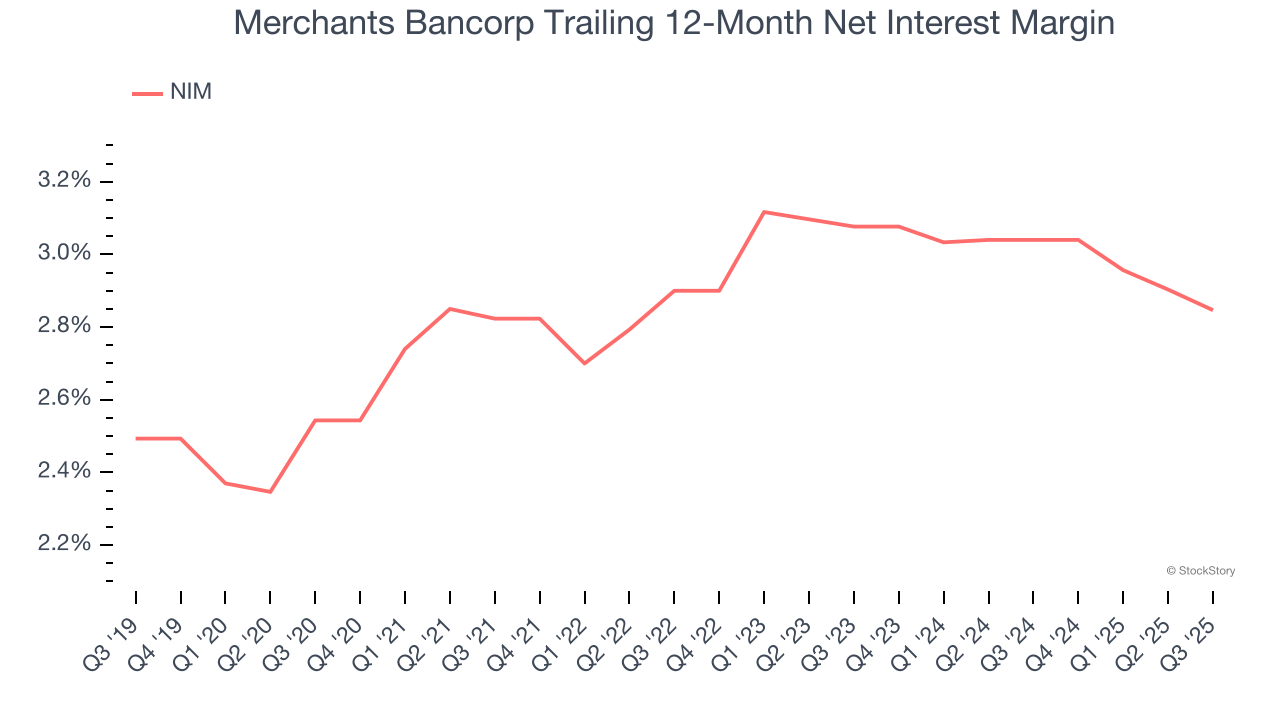
1. Low Net Interest Margin Reveals Weak Loan Book Profitability
Net interest margin (NIM) represents the unit economics of a bank by measuring the profitability of its interest-bearing assets relative to its interest-bearing liabilities. It's a fundamental metric that investors use to assess lending premiums and returns.
Over the past two years, we can see that Merchants Bancorp’s net interest margin averaged a weak 2.9%, indicating the company has weak loan book economics.
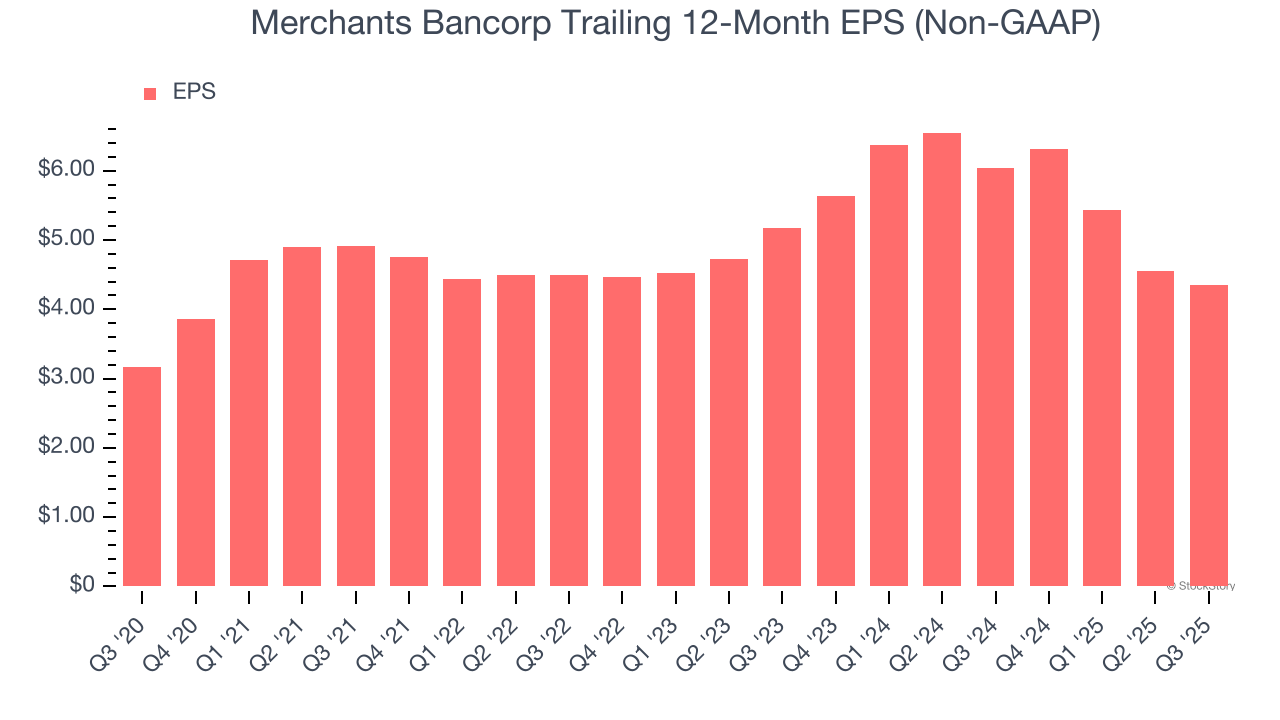
2. EPS Barely Growing
Analyzing the long-term change in earnings per share (EPS) shows whether a company's incremental sales were profitable – for example, revenue could be inflated through excessive spending on advertising and promotions.
Merchants Bancorp’s EPS grew at an unimpressive 6.6% compounded annual growth rate over the last five years, lower than its 18.1% annualized revenue growth. This tells us the company became less profitable on a per-share basis as it expanded.
Leverage is core to a financial firm’s business model (loans funded by deposits). To ensure economic stability and avoid a repeat of the 2008 GFC, regulators require certain levels of capital and liquidity, focusing on the Tier 1 capital ratio.
Tier 1 capital is the highest-quality capital that a firm holds, consisting primarily of common stock and retained earnings, but also physical gold. It serves as the primary cushion against losses and is the first line of defense in times of financial distress.
This capital is divided by risk-weighted assets to derive the Tier 1 capital ratio. Risk-weighted means that cash and US treasury securities are assigned little risk while unsecured consumer loans and equity investments get much higher risk weights, for example.
New regulation after the 2008 financial crisis requires that all firms must maintain a Tier 1 capital ratio greater than 4.5%. On top of this, there are additional buffers based on scale, risk profile, and other regulatory classifications, so that at the end of the day, firms generally must maintain a 7-10% ratio at minimum.
Over the last two years, Merchants Bancorp has averaged a Tier 1 capital ratio of 8.9%, which is considered unsafe in the event of a black swan or if macro or market conditions suddenly deteriorate. For this reason alone, we will be crossing it off our shopping list.
Final Judgment
Merchants Bancorp isn’t a terrible business, but it doesn’t pass our quality test. With its shares trailing the market in recent months, the stock trades at 0.8× forward P/B (or $32.82 per share). This valuation is reasonable, but the company’s shakier fundamentals present too much downside risk. We're fairly confident there are better investments elsewhere. We’d recommend looking at one of our top software and edge computing picks.
High-Quality Stocks for All Market Conditions
If your portfolio success hinges on just 4 stocks, your wealth is built on fragile ground. You have a small window to secure high-quality assets before the market widens and these prices disappear.
Don’t wait for the next volatility shock. Check out our Top 9 Market-Beating Stocks. This is a curated list of our High Quality stocks that have generated a market-beating return of 244% over the last five years (as of June 30, 2025).
Stocks that have made our list include now familiar names such as Nvidia (+1,326% between June 2020 and June 2025) as well as under-the-radar businesses like the once-micro-cap company Kadant (+351% five-year return). Find your next big winner with StockStory today.
StockStory is growing and hiring equity analyst and marketing roles. Are you a 0 to 1 builder passionate about the markets and AI? See the open roles here.


