
Williams-Sonoma trades at $194.34 and has moved in lockstep with the market. Its shares have returned 22.7% over the last six months while the S&P 500 has gained 21%.
Is there a buying opportunity in Williams-Sonoma, or does it present a risk to your portfolio? Get the full breakdown from our expert analysts, it’s free for active Edge members.
Why Is Williams-Sonoma Not Exciting?
We don't have much confidence in Williams-Sonoma. Here are three reasons we avoid WSM and a stock we'd rather own.
1. Stores Are Closing, a Headwind for Revenue
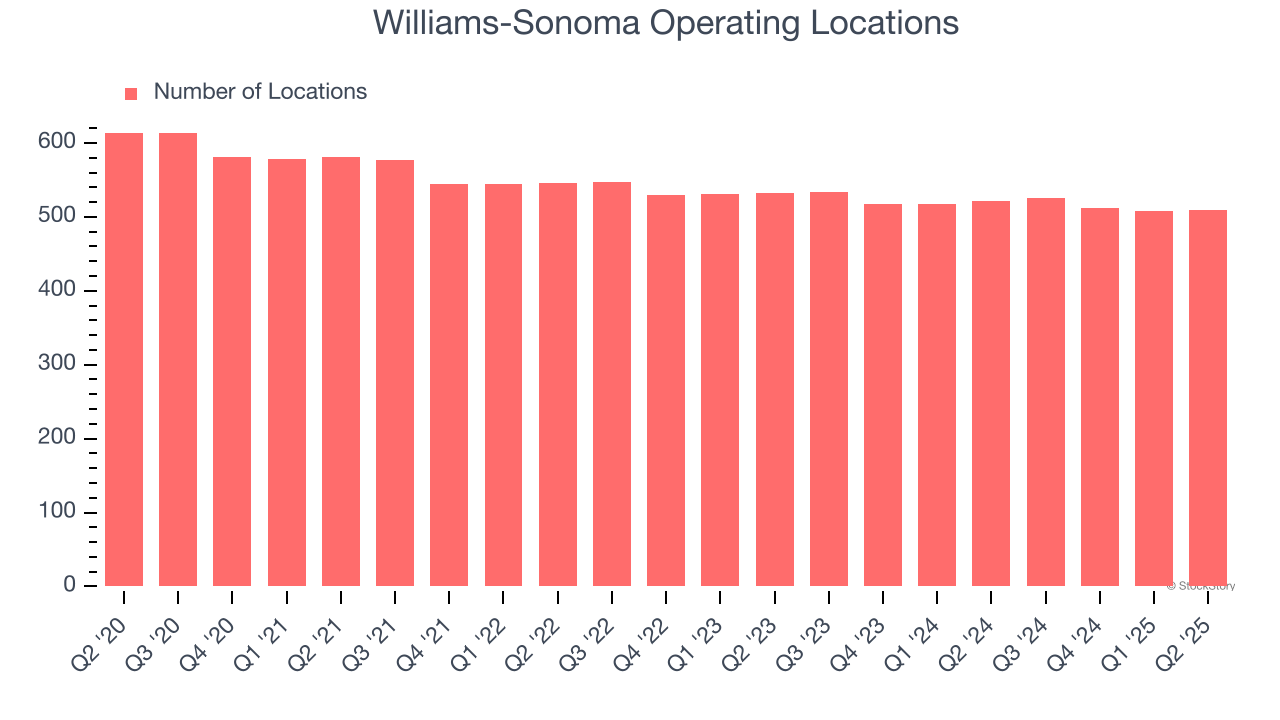
The number of stores a retailer operates is a critical driver of how quickly company-level sales can grow.
Williams-Sonoma operated 509 locations in the latest quarter. Over the last two years, the company has generally closed its stores, averaging 2% annual declines.
When a retailer shutters stores, it usually means that brick-and-mortar demand is less than supply, and it is responding by closing underperforming locations to improve profitability.
2. Shrinking Same-Store Sales Indicate Waning Demand
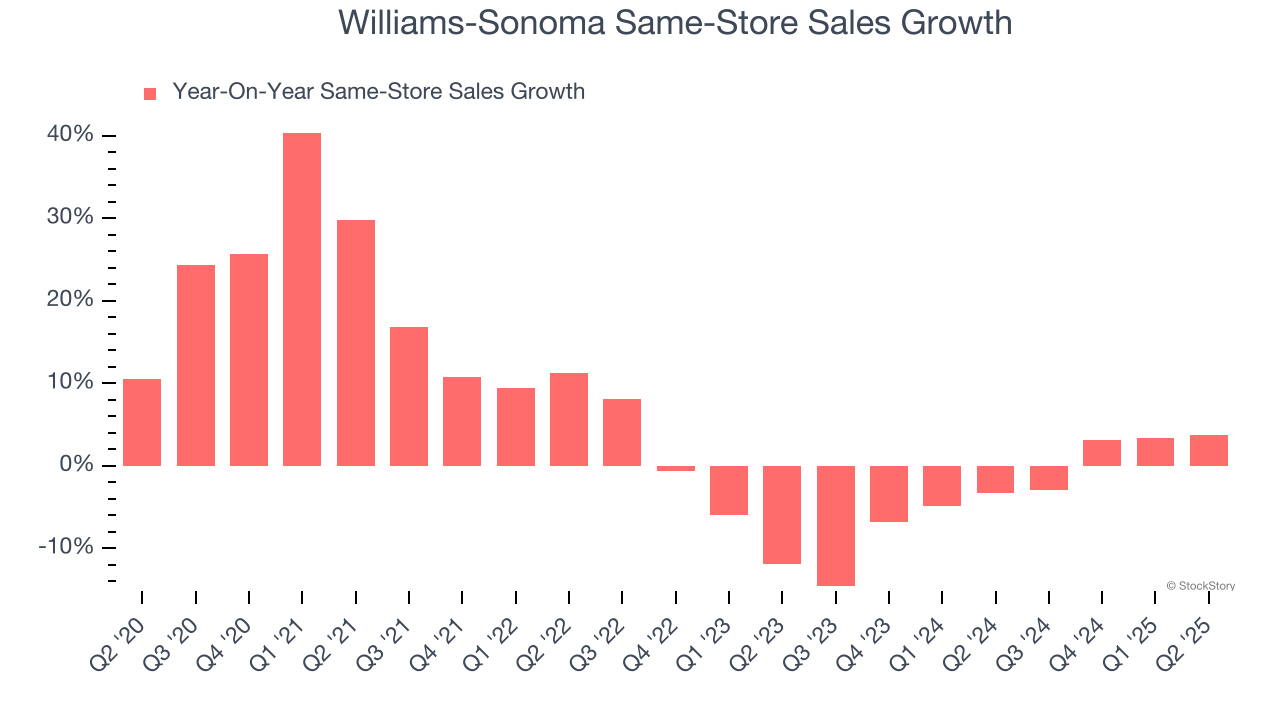
Same-store sales is an industry measure of whether revenue is growing at existing stores, and it is driven by customer visits (often called traffic) and the average spending per customer (ticket).
Williams-Sonoma’s demand has been shrinking over the last two years as its same-store sales have averaged 2.8% annual declines.
3. Free Cash Flow Margin Dropping
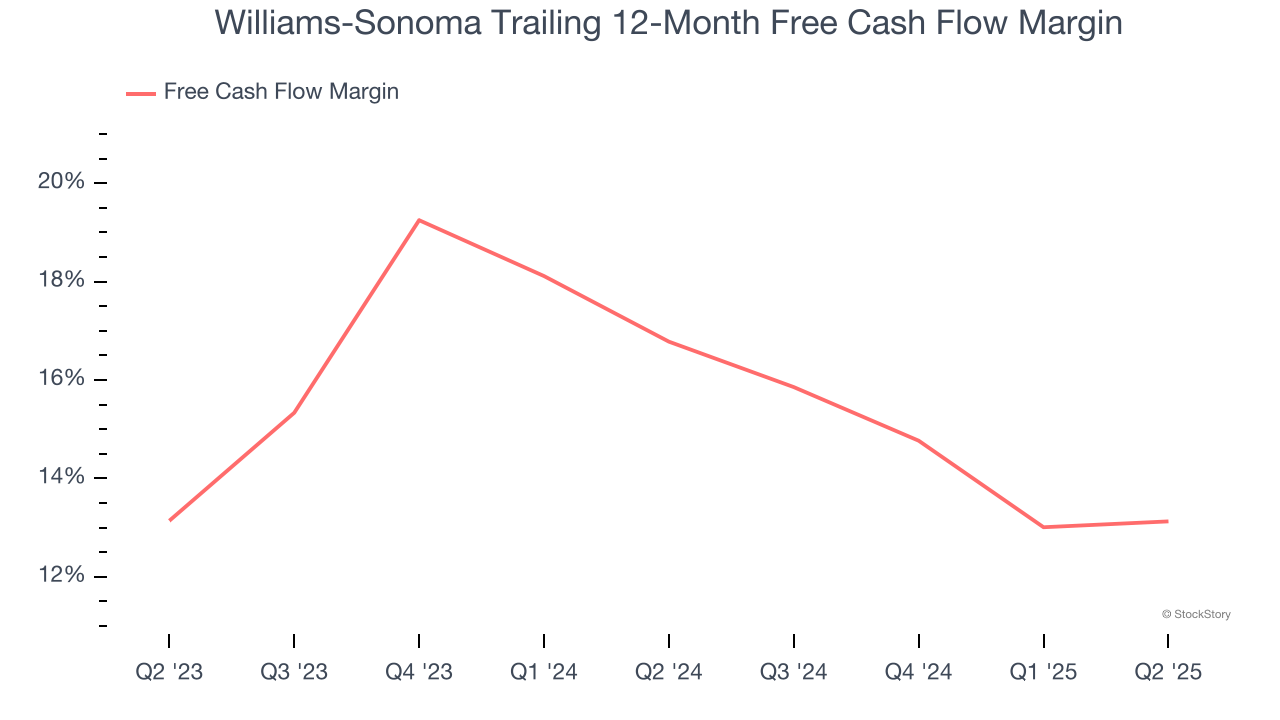
If you’ve followed StockStory for a while, you know we emphasize free cash flow. Why, you ask? We believe that in the end, cash is king, and you can’t use accounting profits to pay the bills.
As you can see below, Williams-Sonoma’s margin dropped by 3.7 percentage points over the last year. This decrease warrants extra caution because Williams-Sonoma failed to grow its same-store sales. Its cash profitability could decay further if it tries to reignite growth by opening new stores.
Final Judgment
Williams-Sonoma isn’t a terrible business, but it doesn’t pass our quality test. That said, the stock currently trades at 22.3× forward P/E (or $194.34 per share). This multiple tells us a lot of good news is priced in - you can find more timely opportunities elsewhere. We’d recommend looking at one of our top software and edge computing picks.
High-Quality Stocks for All Market Conditions
Fresh US-China trade tensions just tanked stocks—but strong bank earnings are fueling a sharp rebound. Don’t miss the bounce.
Don’t let fear keep you from great opportunities and take a look at Top 5 Strong Momentum Stocks for this week. This is a curated list of our High Quality stocks that have generated a market-beating return of 183% over the last five years (as of March 31st 2025).
Stocks that made our list in 2020 include now familiar names such as Nvidia (+1,545% between March 2020 and March 2025) as well as under-the-radar businesses like the once-micro-cap company Tecnoglass (+1,754% five-year return). Find your next big winner with StockStory today.
StockStory is growing and hiring equity analyst and marketing roles. Are you a 0 to 1 builder passionate about the markets and AI? See the open roles here.