
Asset management company Affiliated Managers Group (NYSE: AMG) fell short of the markets revenue expectations in Q3 CY2025 as sales rose 2.2% year on year to $528 million. Its non-GAAP profit of $6.10 per share was 3.7% above analysts’ consensus estimates.
Is now the time to buy Affiliated Managers Group? Find out by accessing our full research report, it’s free for active Edge members.
Affiliated Managers Group (AMG) Q3 CY2025 Highlights:
Company Overview
Using a partnership approach that preserves entrepreneurial culture at its portfolio companies, Affiliated Managers Group (NYSE: AMG) is an investment firm that acquires stakes in boutique asset management companies while allowing them to maintain operational independence.
Revenue Growth
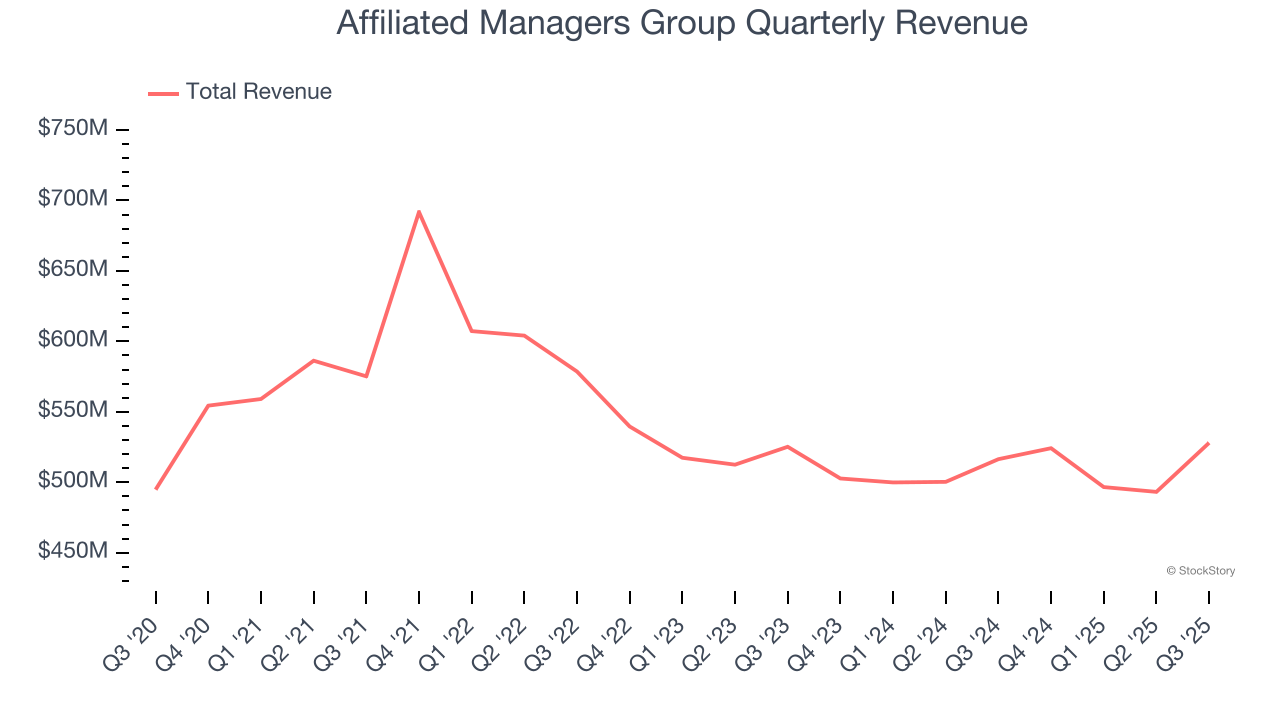
A company’s long-term performance is an indicator of its overall quality. Any business can put up a good quarter or two, but the best consistently grow over the long haul. Unfortunately, Affiliated Managers Group struggled to consistently increase demand as its $2.04 billion of revenue for the trailing 12 months was close to its revenue five years ago. This was below our standards and is a sign of lacking business quality.
We at StockStory place the most emphasis on long-term growth, but within financials, a half-decade historical view may miss recent interest rate changes, market returns, and industry trends. Affiliated Managers Group’s recent performance shows its demand remained suppressed as its revenue has declined by 1.3% annually over the last two years. 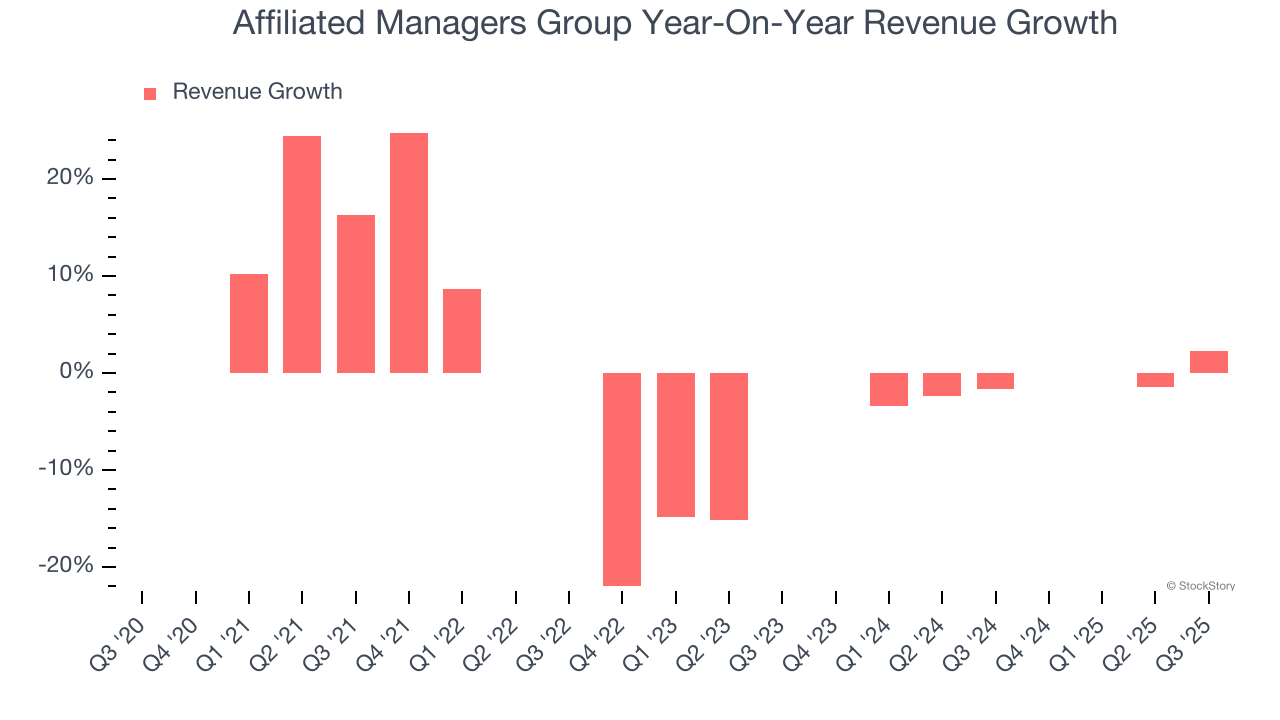 Note: Quarters not shown were determined to be outliers, impacted by outsized investment gains/losses that are not indicative of the recurring fundamentals of the business.
This quarter, Affiliated Managers Group’s revenue grew by 2.2% year on year to $528 million, falling short of Wall Street’s estimates.
Microsoft, Alphabet, Coca-Cola, Monster Beverage—all began as under-the-radar growth stories riding a massive trend. We’ve identified the next one: a profitable AI semiconductor play Wall Street is still overlooking. Go here for access to our full report.
Assets Under Management (AUM)
Assets Under Management (AUM) represents the total value of investments that a financial institution manages for its clients. These assets generate steady income through management fees, creating predictable revenue streams that remain stable so long as clients remain invested with the firm.
Affiliated Managers Group’s AUM has grown at an annual rate of 5.7% over the last five years, worse than the broader financials industry but faster than its total revenue. When analyzing Affiliated Managers Group’s AUM over the last two years, we can see that growth accelerated to 6.7% annually. Fundraising or short-term investment performance were net contributors for the company over this shorter period since assets grew faster than total revenue. But again, we put less weight on asset growth given how lumpy and cyclical it can be.
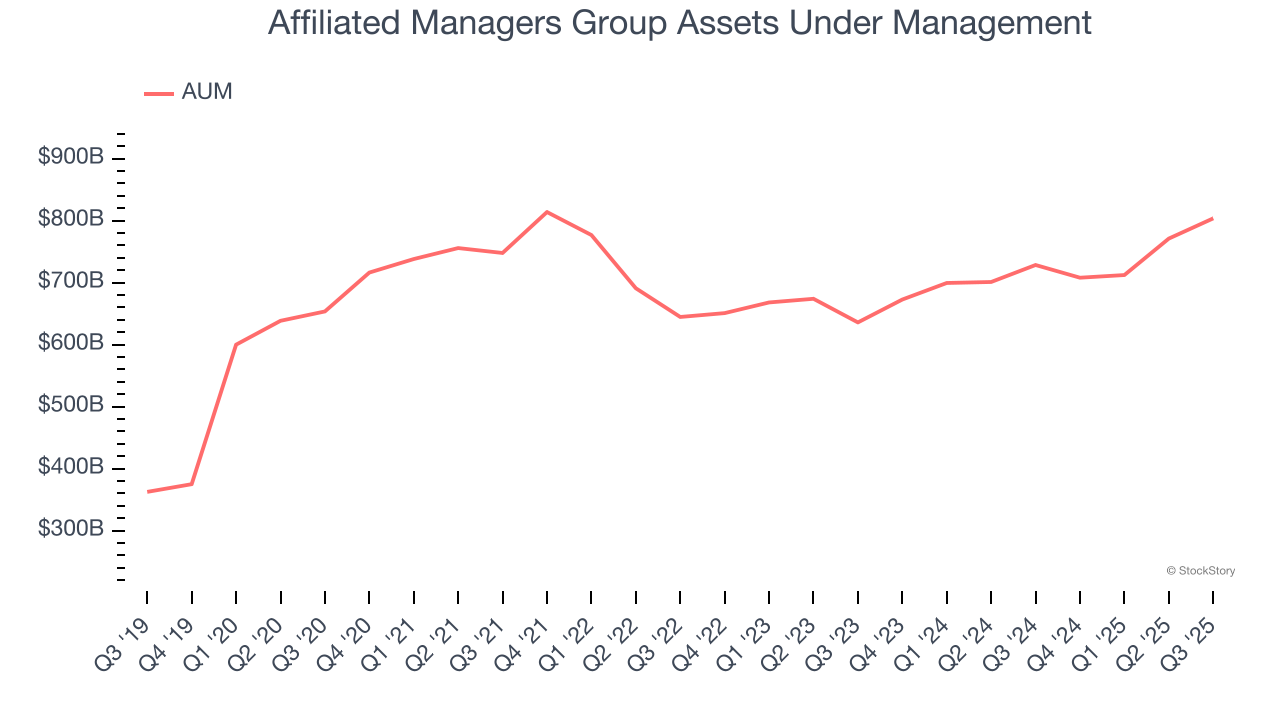
In Q3, Affiliated Managers Group’s AUM was $803.6 billion, beating analysts’ expectations by 2.1%. This print was 10.3% higher than the same quarter last year.
Key Takeaways from Affiliated Managers Group’s Q3 Results
We enjoyed seeing Affiliated Managers Group beat analysts’ AUM expectations this quarter. We were also glad its EPS outperformed Wall Street’s estimates. On the other hand, its revenue slightly missed. Overall, this quarter was mixed. The stock traded up 1.7% to $242.10 immediately following the results.
Big picture, is Affiliated Managers Group a buy here and now? We think that the latest quarter is only one piece of the longer-term business quality puzzle. Quality, when combined with valuation, can help determine if the stock is a buy. We cover that in our actionable full research report which you can read here, it’s free for active Edge members.


