Live sports and TV streaming service fuboTV (NYSE: FUBO) reported revenue ahead of Wall Streets expectations in Q3 CY2025, but sales fell by 2.3% year on year to $377.2 million. Its non-GAAP profit of $0.02 per share was significantly above analysts’ consensus estimates.
Is now the time to buy fuboTV? Find out by accessing our full research report, it’s free for active Edge members.
fuboTV (FUBO) Q3 CY2025 Highlights:
- Revenue: $377.2 million vs analyst estimates of $359.7 million (2.3% year-on-year decline, 4.9% beat)
- Adjusted EPS: $0.02 vs analyst estimates of -$0.04 (6c beat)
- Adjusted EBITDA: $6.92 million vs analyst estimates of -$6.38 million (1.8% margin, beat)
- Operating Margin: -5.3%, up from -15.2% in the same quarter last year
- Free Cash Flow was -$9.41 million compared to -$1.12 million in the same quarter last year
- Domestic Subscribers: 1.63 million, up 18,000 year on year
- Market Capitalization: $4.88 billion
Company Overview
Originally launched as a soccer streaming platform, fuboTV (NYSE: FUBO) is a video streaming service specializing in live sports, news, and entertainment content.
Revenue Growth
Reviewing a company’s long-term sales performance reveals insights into its quality. Even a bad business can shine for one or two quarters, but a top-tier one grows for years. Luckily, fuboTV’s sales grew at an incredible 50.5% compounded annual growth rate over the last five years. Its growth beat the average consumer discretionary company and shows its offerings resonate with customers.
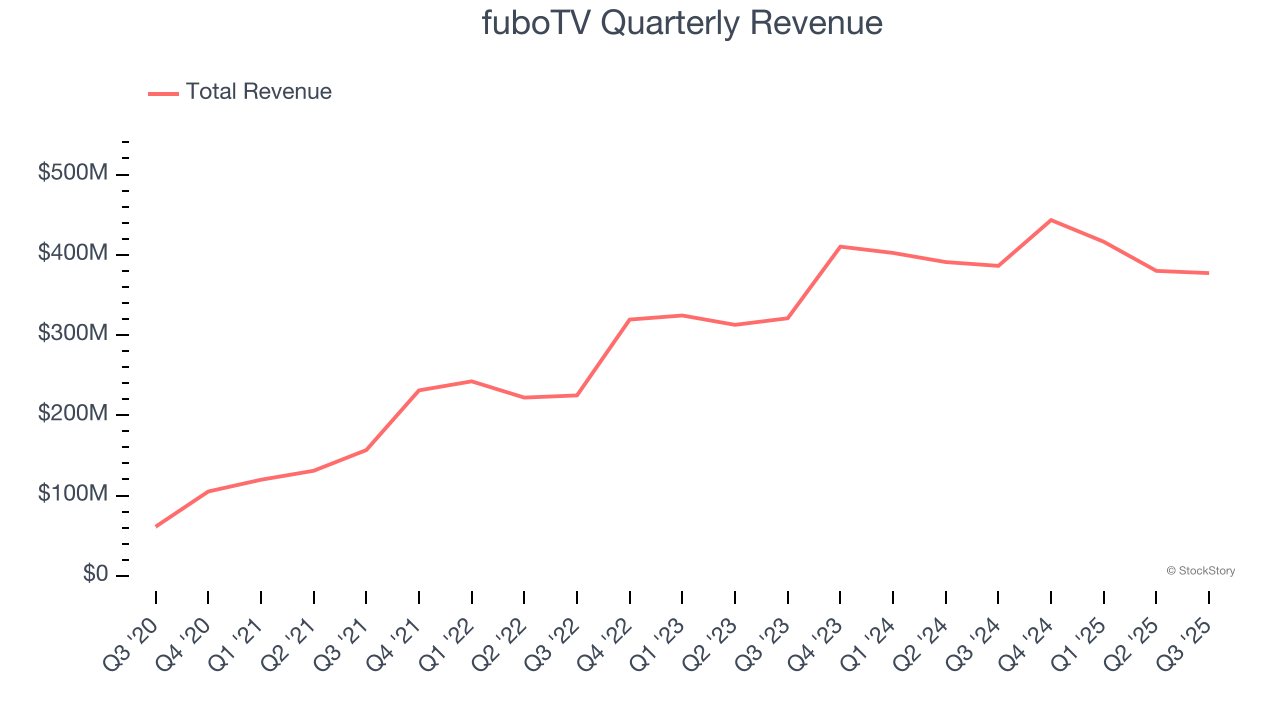
We at StockStory place the most emphasis on long-term growth, but within consumer discretionary, a stretched historical view may miss a company riding a successful new product or trend. fuboTV’s recent performance shows its demand has slowed significantly as its annualized revenue growth of 12.5% over the last two years was well below its five-year trend. 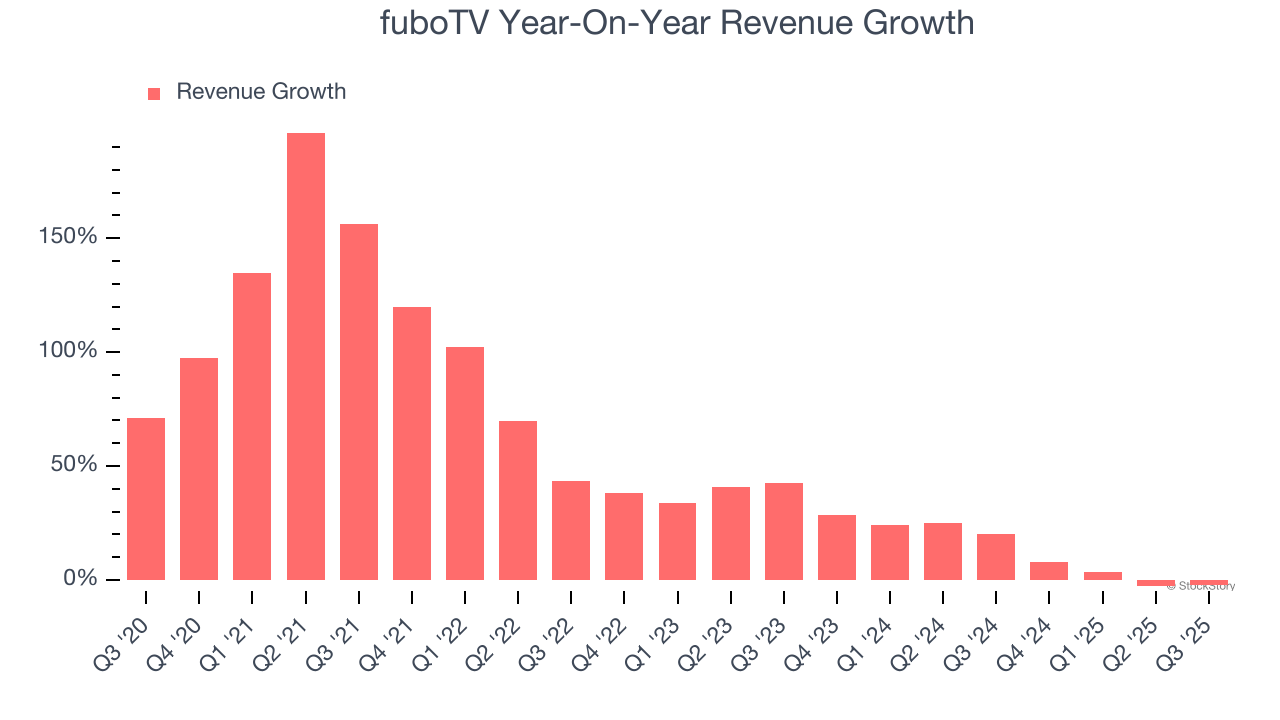
We can better understand the company’s revenue dynamics by analyzing its number of domestic subscribers and international subscribers, which clocked in at 1.63 million and 342,000 in the latest quarter. Over the last two years, fuboTV’s domestic subscribers averaged 7.3% year-on-year growth. On the other hand, its international subscribers averaged 6.1% year-on-year declines. 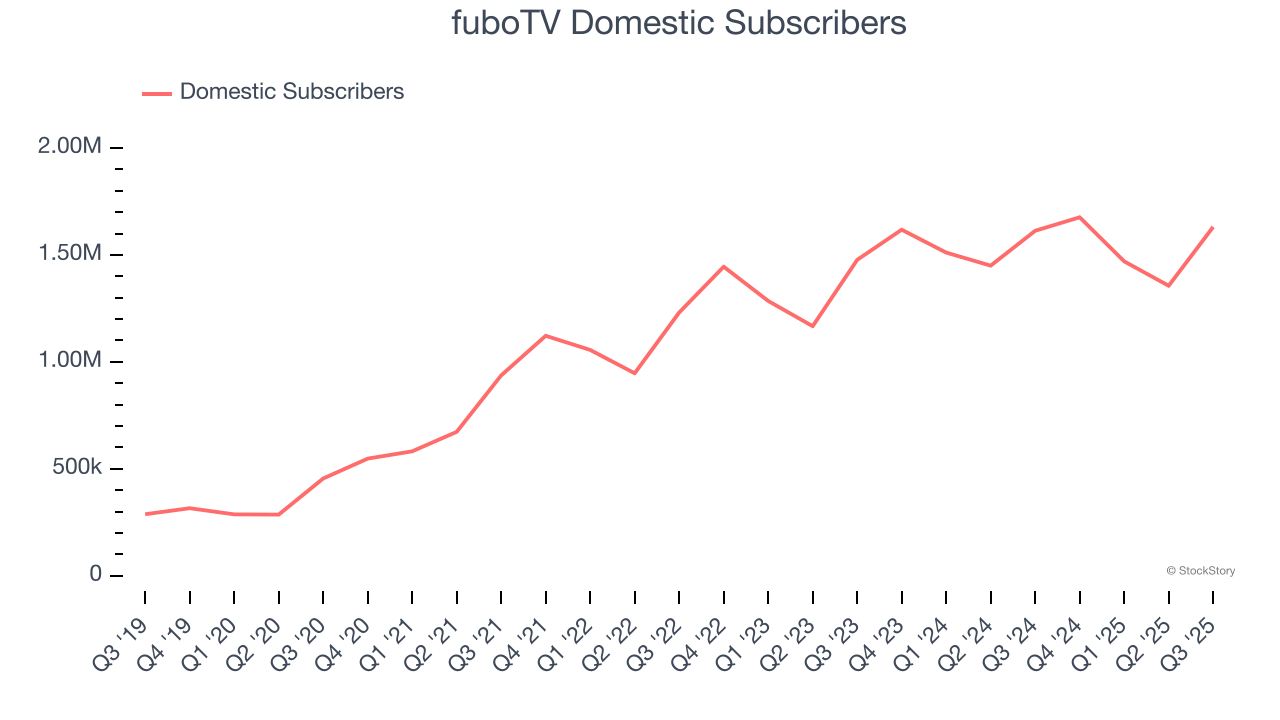
This quarter, fuboTV’s revenue fell by 2.3% year on year to $377.2 million but beat Wall Street’s estimates by 4.9%.
Looking ahead, sell-side analysts expect revenue to remain flat over the next 12 months, a deceleration versus the last two years. This projection is underwhelming and suggests its products and services will see some demand headwinds.
Microsoft, Alphabet, Coca-Cola, Monster Beverage—all began as under-the-radar growth stories riding a massive trend. We’ve identified the next one: a profitable AI semiconductor play Wall Street is still overlooking. Go here for access to our full report.
Operating Margin
Operating margin is a key measure of profitability. Think of it as net income - the bottom line - excluding the impact of taxes and interest on debt, which are less connected to business fundamentals.
fuboTV’s operating margin has been trending up over the last 12 months, but it still averaged negative 10% over the last two years. This is due to its large expense base and inefficient cost structure.
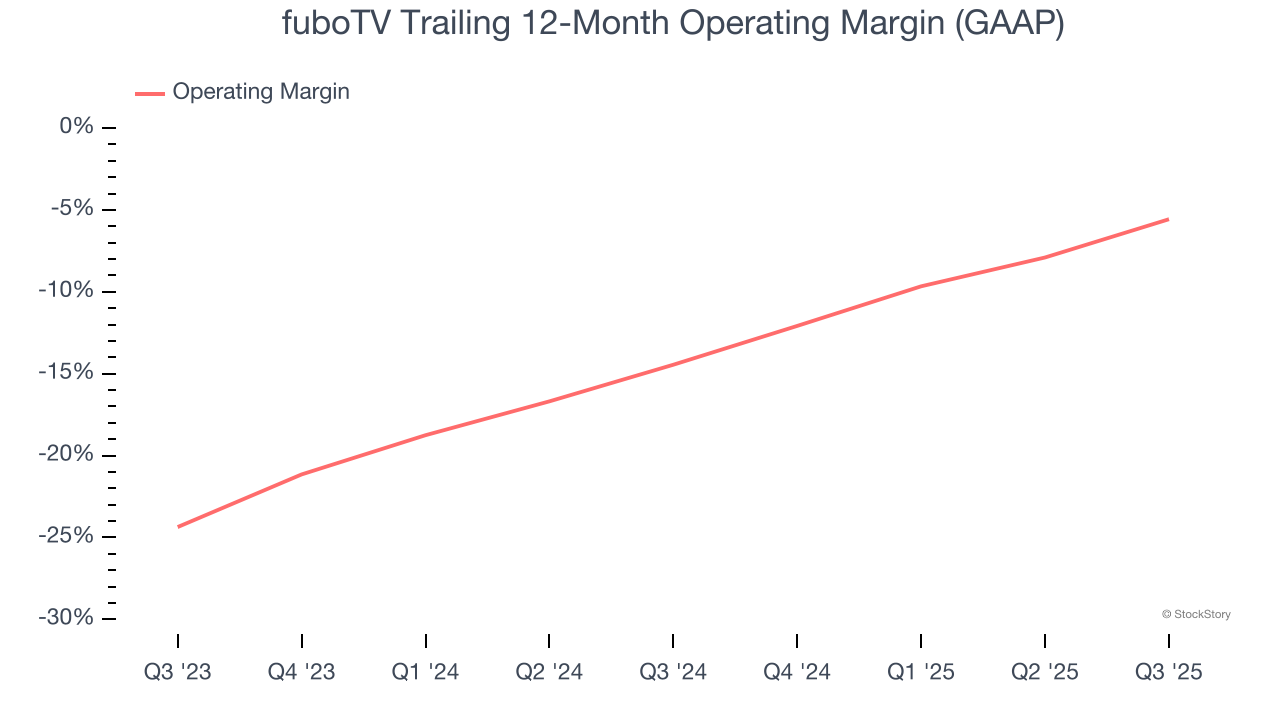
In Q3, fuboTV generated a negative 5.3% operating margin.
Earnings Per Share
Revenue trends explain a company’s historical growth, but the long-term change in earnings per share (EPS) points to the profitability of that growth – for example, a company could inflate its sales through excessive spending on advertising and promotions.
fuboTV’s full-year EPS flipped from negative to positive over the last four years. This is encouraging and shows it’s at a critical moment in its life.
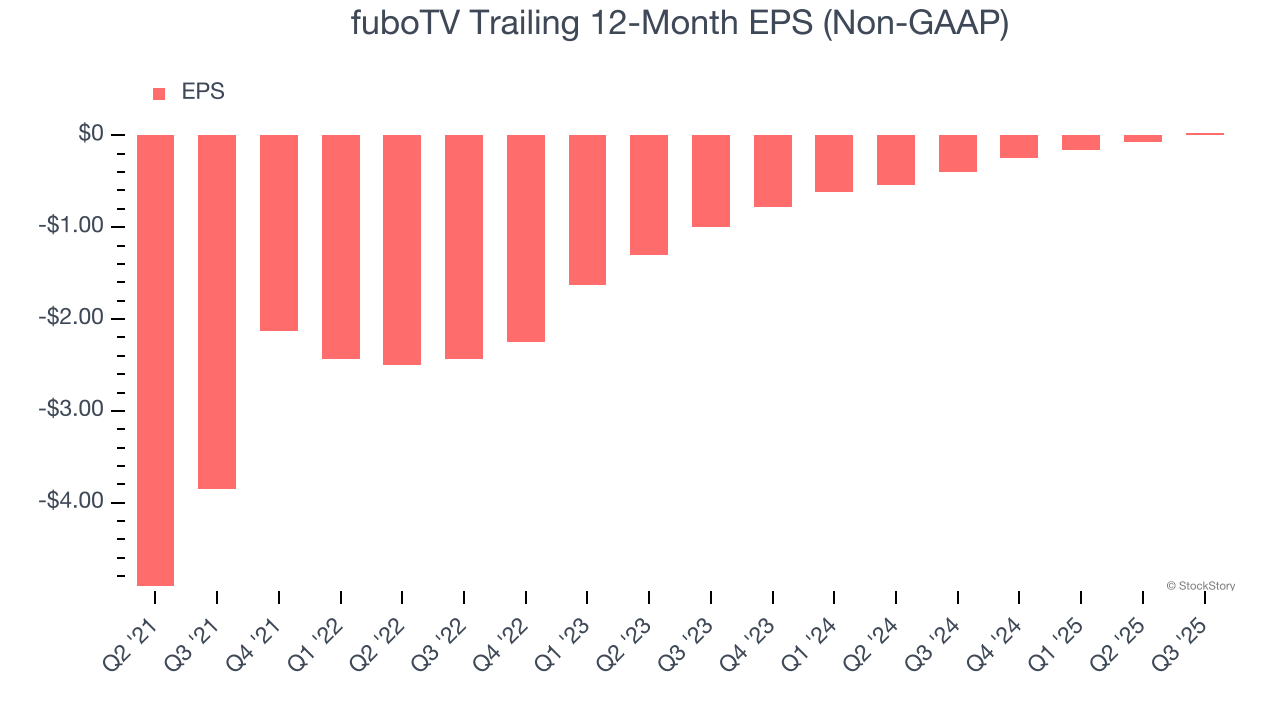
In Q3, fuboTV reported adjusted EPS of $0.02, up from negative $0.08 in the same quarter last year. This print easily cleared analysts’ estimates, and shareholders should be content with the results. Over the next 12 months, Wall Street expects fuboTV’s full-year EPS of $0.03 to shrink by 58.3%.
Key Takeaways from fuboTV’s Q3 Results
It was good to see fuboTV beat analysts’ revenue, EBITDA and EPS expectations this quarter. On the other hand, its number of international subscribers missed. Zooming out, we think this was still a solid print. The stock traded up 3.7% to $3.93 immediately following the results.
fuboTV may have had a good quarter, but does that mean you should invest right now? What happened in the latest quarter matters, but not as much as longer-term business quality and valuation, when deciding whether to invest in this stock. We cover that in our actionable full research report which you can read here, it’s free for active Edge members.