Digital media conglomerate IAC (NASDAQGS:IAC) missed Wall Street’s revenue expectations in Q3 CY2025, with sales falling 8.1% year on year to $589.8 million. Its GAAP loss of $0.27 per share was 19.1% below analysts’ consensus estimates.
Is now the time to buy IAC? Find out by accessing our full research report, it’s free for active Edge members.
IAC (IAC) Q3 CY2025 Highlights:
- Revenue: $589.8 million vs analyst estimates of $602 million (8.1% year-on-year decline, 2% miss)
- EPS (GAAP): -$0.27 vs analyst expectations of -$0.23 (19.1% miss)
- Adjusted EBITDA: $54.63 million vs analyst estimates of $51.15 million (9.3% margin, 6.8% beat)
- Operating Margin: -3.5%, down from 1.3% in the same quarter last year
- Free Cash Flow Margin: 4.3%, down from 22.3% in the same quarter last year
- Market Capitalization: $2.58 billion
Company Overview
Originally known as InterActiveCorp and built through Barry Diller's strategic acquisitions since the 1990s, IAC (NASDAQ: IAC) operates a portfolio of category-leading digital businesses including Dotdash Meredith, Angi, and Care.com, focusing on digital publishing, home services, and caregiving platforms.
Revenue Growth
A company’s long-term sales performance can indicate its overall quality. Any business can experience short-term success, but top-performing ones enjoy sustained growth for years.
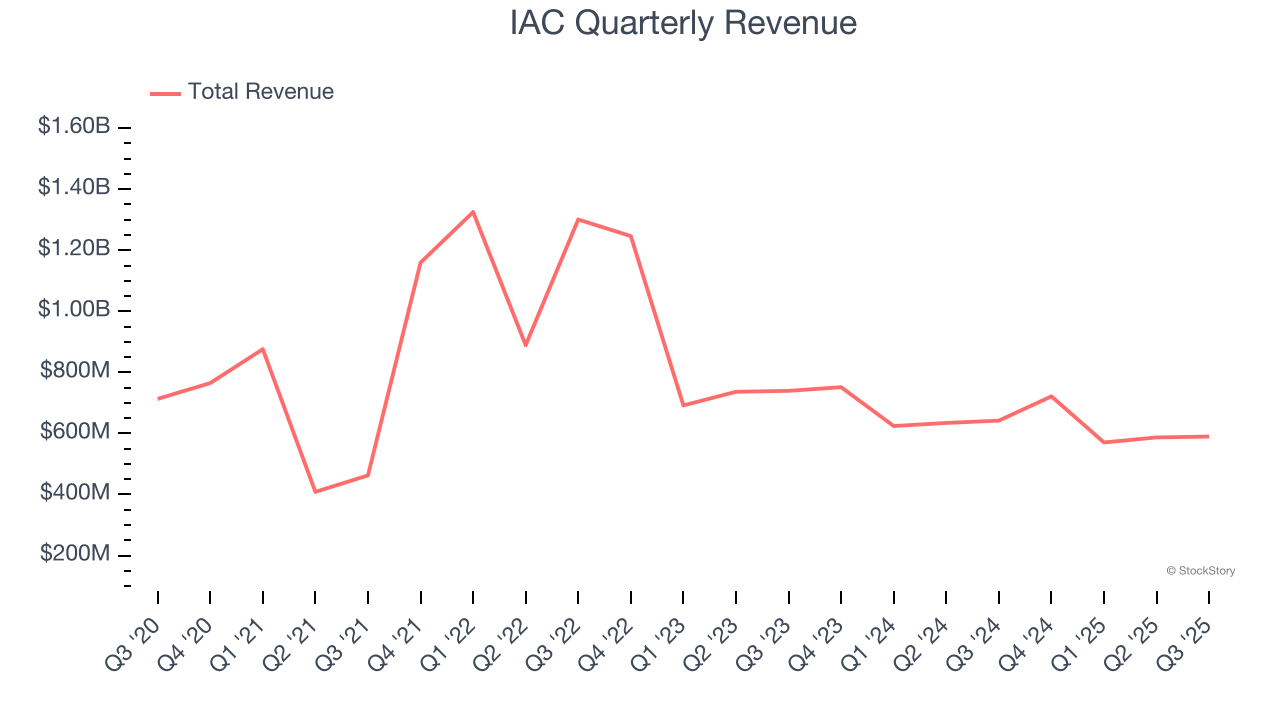
With $2.47 billion in revenue over the past 12 months, IAC is a mid-sized business services company, which sometimes brings disadvantages compared to larger competitors benefiting from better economies of scale.
As you can see below, IAC struggled to increase demand as its $2.47 billion of sales for the trailing 12 months was close to its revenue five years ago. This shows demand was soft, a poor baseline for our analysis.
Long-term growth is the most important, but within business services, a half-decade historical view may miss new innovations or demand cycles. IAC’s recent performance shows its demand remained suppressed as its revenue has declined by 15% annually over the last two years. 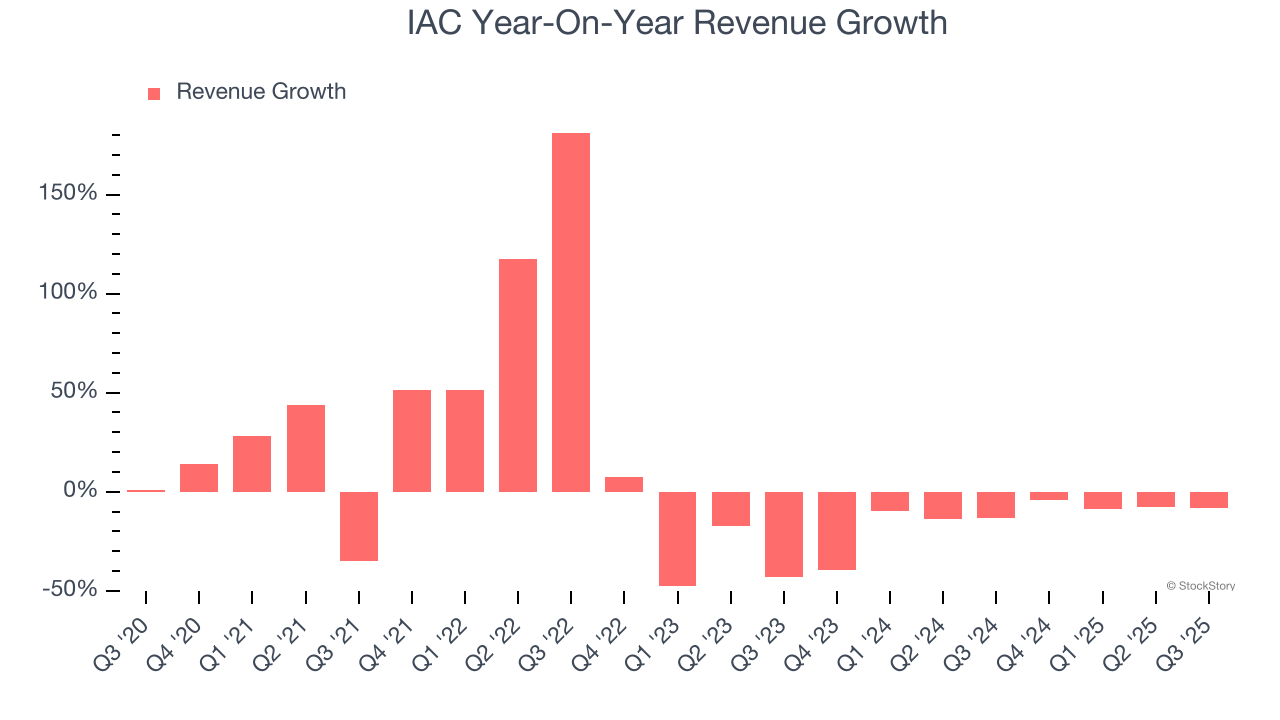
This quarter, IAC missed Wall Street’s estimates and reported a rather uninspiring 8.1% year-on-year revenue decline, generating $589.8 million of revenue.
Looking ahead, sell-side analysts expect revenue to decline by 2.2% over the next 12 months. Although this projection is better than its two-year trend, it’s hard to get excited about a company that is struggling with demand.
Software is eating the world and there is virtually no industry left that has been untouched by it. That drives increasing demand for tools helping software developers do their jobs, whether it be monitoring critical cloud infrastructure, integrating audio and video functionality, or ensuring smooth content streaming. Click here to access a free report on our 3 favorite stocks to play this generational megatrend.
Operating Margin
Operating margin is one of the best measures of profitability because it tells us how much money a company takes home after subtracting all core expenses, like marketing and R&D.
IAC’s high expenses have contributed to an average operating margin of negative 5.7% over the last five years. Unprofitable business services companies require extra attention because they could get caught swimming naked when the tide goes out. It’s hard to trust that the business can endure a full cycle.
On the plus side, IAC’s operating margin rose by 6.4 percentage points over the last five years. Still, it will take much more for the company to reach long-term profitability.
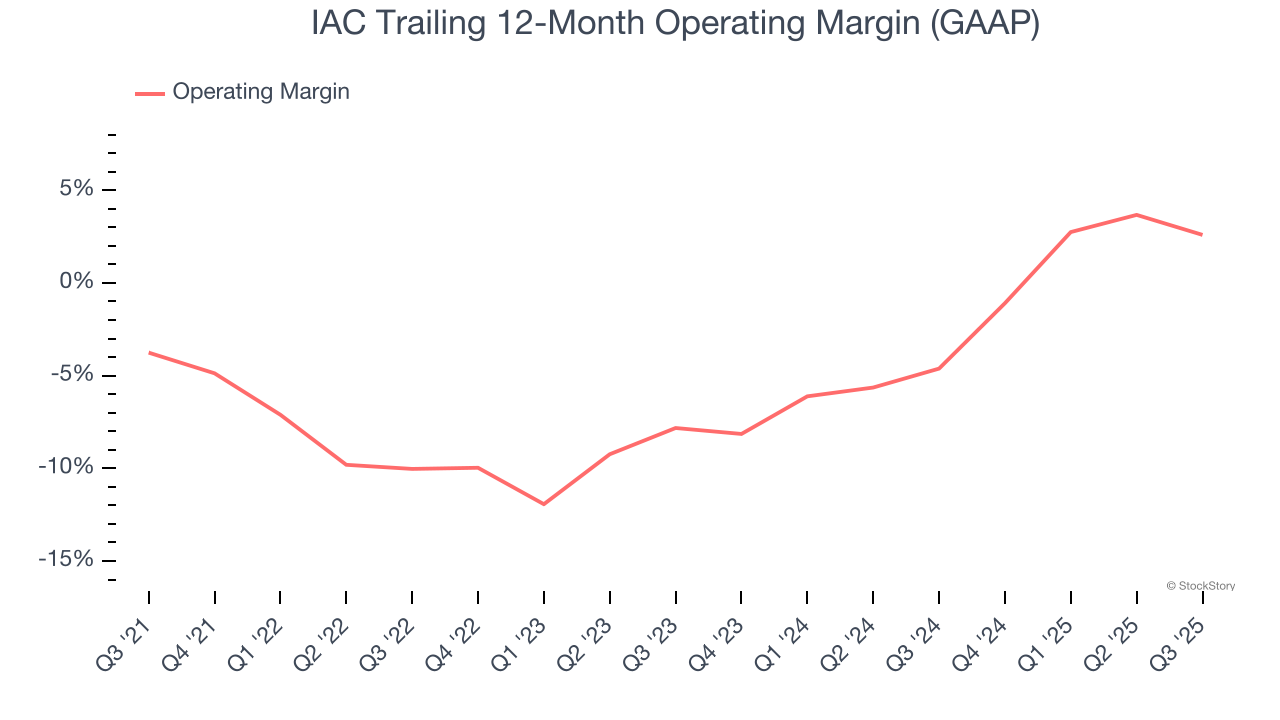
This quarter, IAC generated a negative 3.5% operating margin. The company's consistent lack of profits raise a flag.
Earnings Per Share
We track the long-term change in earnings per share (EPS) for the same reason as long-term revenue growth. Compared to revenue, however, EPS highlights whether a company’s growth is profitable.
IAC’s full-year EPS was flat over the last five years. This performance was underwhelming across the board.
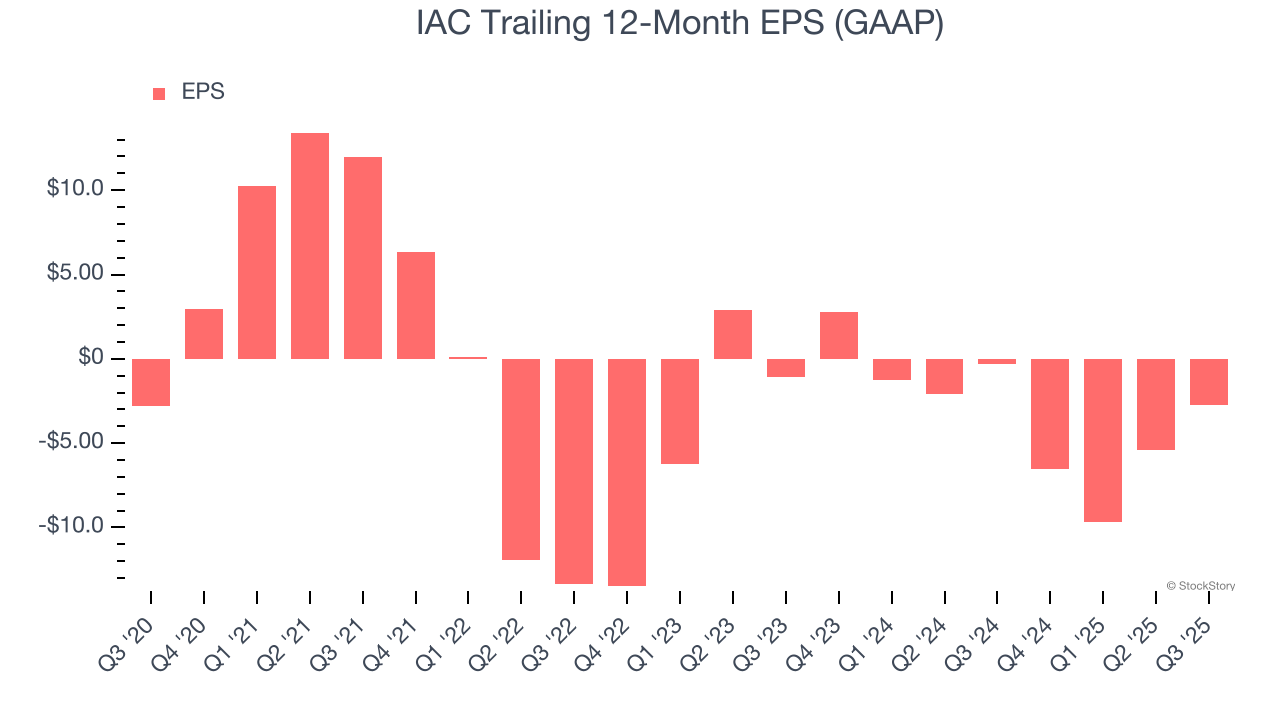
Like with revenue, we analyze EPS over a more recent period because it can provide insight into an emerging theme or development for the business.
For IAC, its two-year annual EPS declines of 60.7% show its recent history was to blame for its underperformance over the last five years. These results were bad no matter how you slice the data.
In Q3, IAC reported EPS of negative $0.27, up from negative $2.93 in the same quarter last year. Despite growing year on year, this print missed analysts’ estimates. Over the next 12 months, Wall Street is optimistic. Analysts forecast IAC’s full-year EPS of negative $2.73 will flip to positive $0.18.
Key Takeaways from IAC’s Q3 Results
We struggled to find many positives in these results. Its revenue missed and its EPS fell short of Wall Street’s estimates. Overall, this quarter could have been better. The stock traded down 8.3% to $29.90 immediately after reporting.
IAC didn’t show it’s best hand this quarter, but does that create an opportunity to buy the stock right now? What happened in the latest quarter matters, but not as much as longer-term business quality and valuation, when deciding whether to invest in this stock. We cover that in our actionable full research report which you can read here, it’s free for active Edge members.