Biotech company Vertex Pharmaceuticals (NASDAQ: VRTX) met Wall Streets revenue expectations in Q3 CY2025, with sales up 11% year on year to $3.08 billion. The company’s outlook for the full year was close to analysts’ estimates with revenue guided to $11.95 billion at the midpoint. Its non-GAAP profit of $4.80 per share was 4.9% above analysts’ consensus estimates.
Is now the time to buy Vertex Pharmaceuticals? Find out by accessing our full research report, it’s free for active Edge members.
Vertex Pharmaceuticals (VRTX) Q3 CY2025 Highlights:
- Revenue: $3.08 billion vs analyst estimates of $3.06 billion (11% year-on-year growth, in line)
- Adjusted EPS: $4.80 vs analyst estimates of $4.58 (4.9% beat)
- Adjusted Operating Income: $1.38 billion vs analyst estimates of $1.38 billion (45% margin, in line)
- The company slightly lifted its revenue guidance for the full year to $11.95 billion at the midpoint from $11.93 billion
- Operating Margin: 38.6%, down from 40.3% in the same quarter last year
- Market Capitalization: $109.1 billion
Company Overview
Founded in 1989 with a mission to create medicines that treat the underlying causes of disease rather than just symptoms, Vertex Pharmaceuticals (NASDAQ: VRTX) develops and markets transformative medicines for serious diseases, with a focus on cystic fibrosis, sickle cell disease, and pain management.
Revenue Growth
A company’s long-term sales performance can indicate its overall quality. Any business can experience short-term success, but top-performing ones enjoy sustained growth for years. Over the last five years, Vertex Pharmaceuticals grew its sales at a solid 14.4% compounded annual growth rate. Its growth beat the average healthcare company and shows its offerings resonate with customers, a helpful starting point for our analysis.
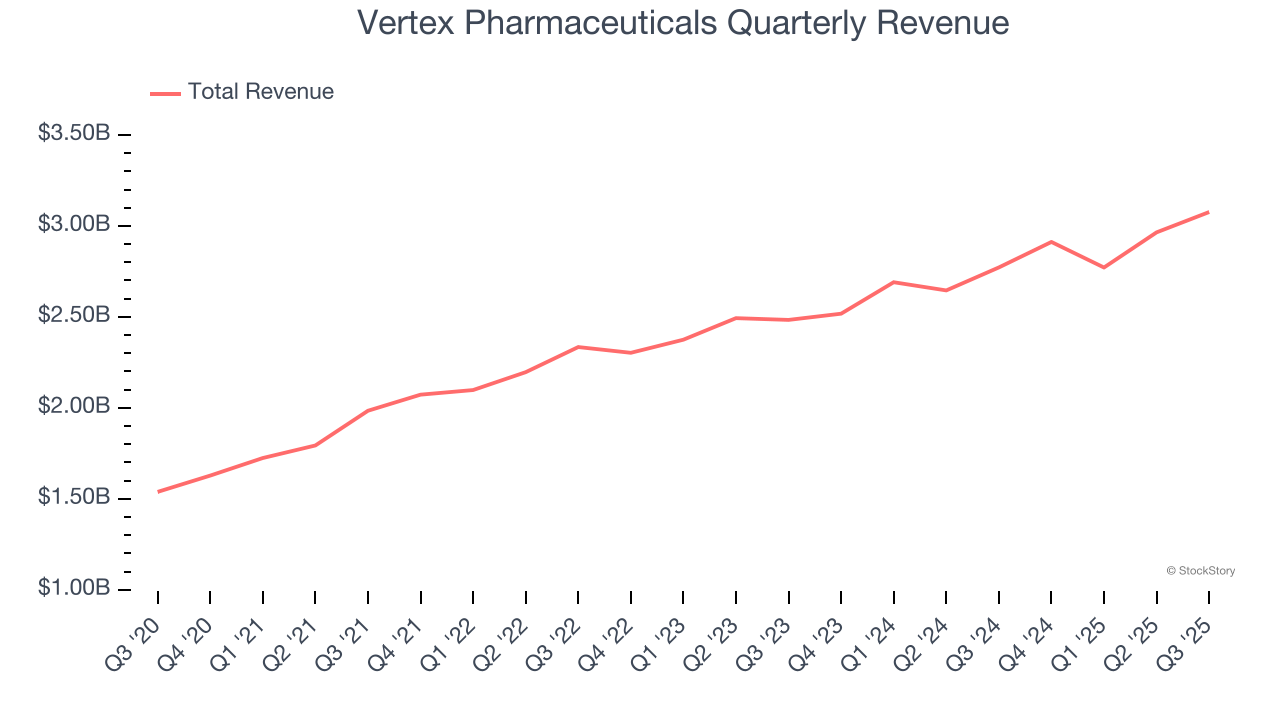
We at StockStory place the most emphasis on long-term growth, but within healthcare, a half-decade historical view may miss recent innovations or disruptive industry trends. Vertex Pharmaceuticals’s annualized revenue growth of 10.2% over the last two years is below its five-year trend, but we still think the results were respectable. 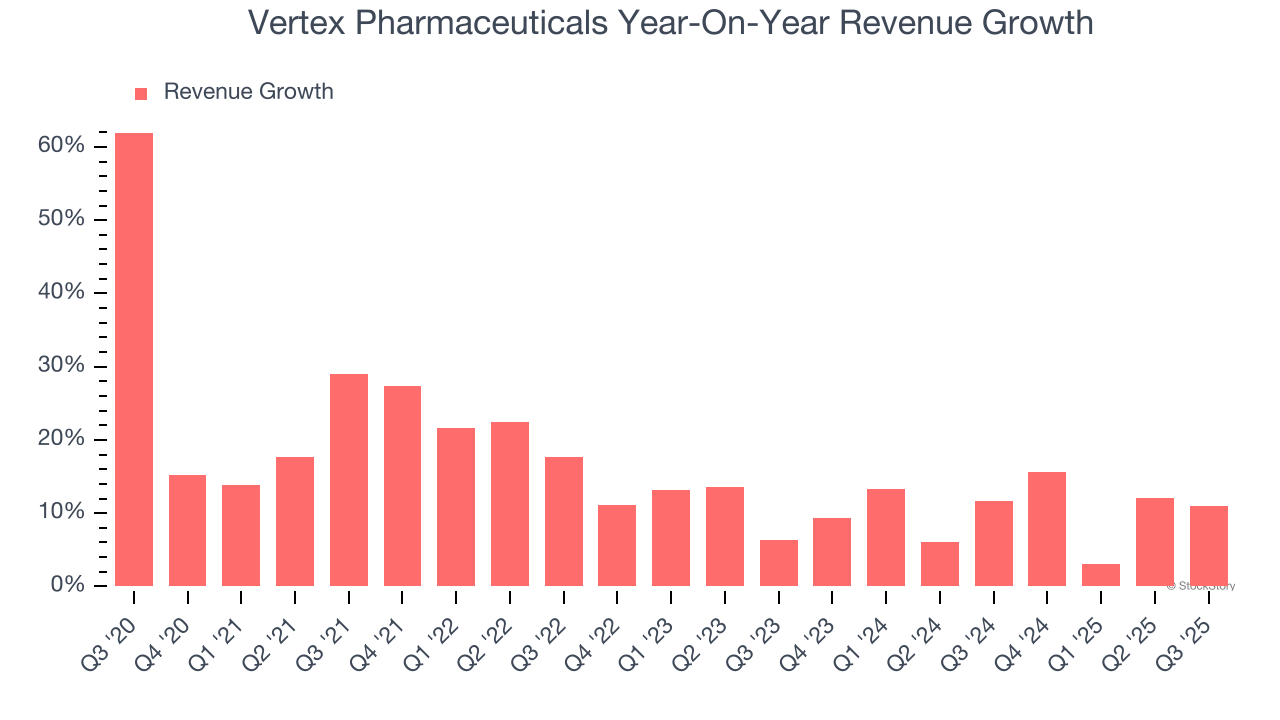
This quarter, Vertex Pharmaceuticals’s year-on-year revenue growth was 11%, and its $3.08 billion of revenue was in line with Wall Street’s estimates.
Looking ahead, sell-side analysts expect revenue to grow 9.5% over the next 12 months, similar to its two-year rate. This projection is particularly noteworthy for a company of its scale and indicates the market sees success for its products and services.
While Wall Street chases Nvidia at all-time highs, an under-the-radar semiconductor supplier is dominating a critical AI component these giants can’t build without. Click here to access our free report one of our favorites growth stories.
Adjusted Operating Margin
Adjusted operating margin is a key measure of profitability. Think of it as net income (the bottom line) excluding the impact of non-recurring expenses, taxes, and interest on debt - metrics less connected to business fundamentals.
Vertex Pharmaceuticals has been a well-oiled machine over the last five years. It demonstrated elite profitability for a healthcare business, boasting an average adjusted operating margin of 39.4%.
Analyzing the trend in its profitability, Vertex Pharmaceuticals’s adjusted operating margin decreased by 14.2 percentage points over the last five years. The company’s two-year trajectory also shows it failed to get its profitability back to the peak as its margin fell by 1.9 percentage points. This performance was poor no matter how you look at it - it shows its expenses were rising and it couldn’t pass those costs onto its customers.
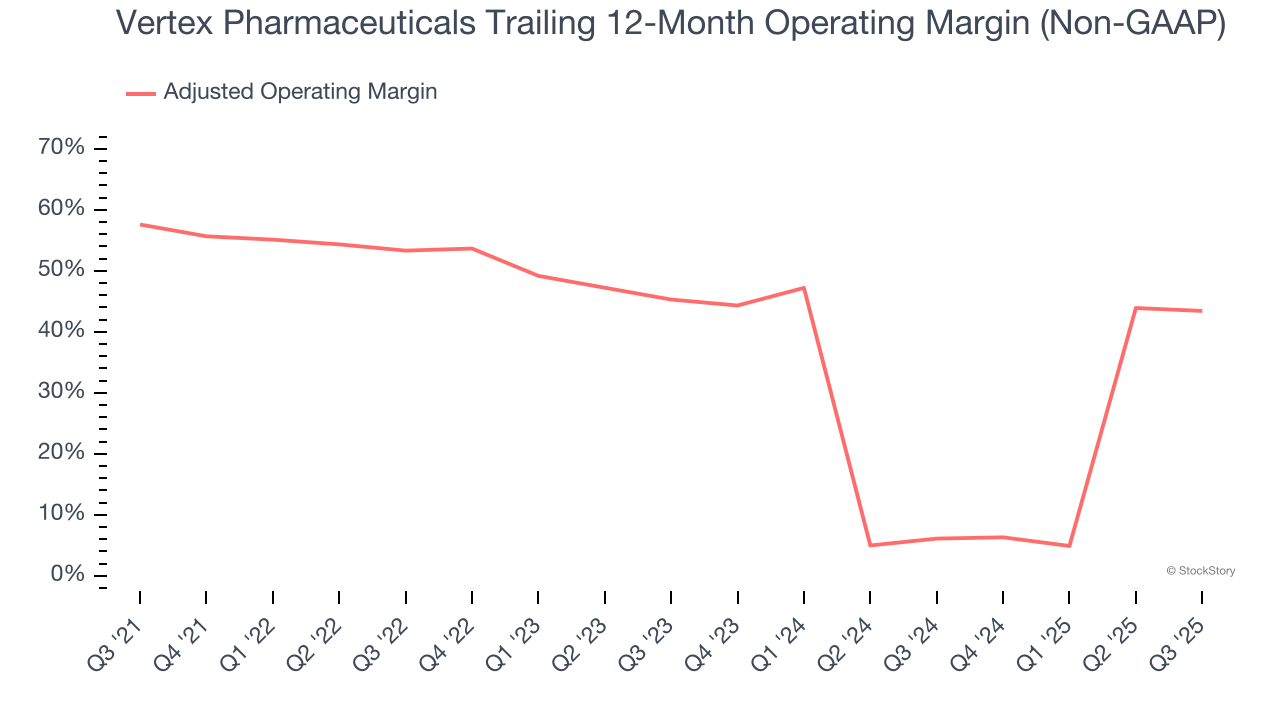
This quarter, Vertex Pharmaceuticals generated an adjusted operating margin profit margin of 45%, down 2.1 percentage points year on year. This contraction shows it was less efficient because its expenses grew faster than its revenue.
Earnings Per Share
We track the long-term change in earnings per share (EPS) for the same reason as long-term revenue growth. Compared to revenue, however, EPS highlights whether a company’s growth is profitable.
Vertex Pharmaceuticals’s spectacular 12.8% annual EPS growth over the last five years aligns with its revenue performance. This tells us it maintained its per-share profitability as it expanded.
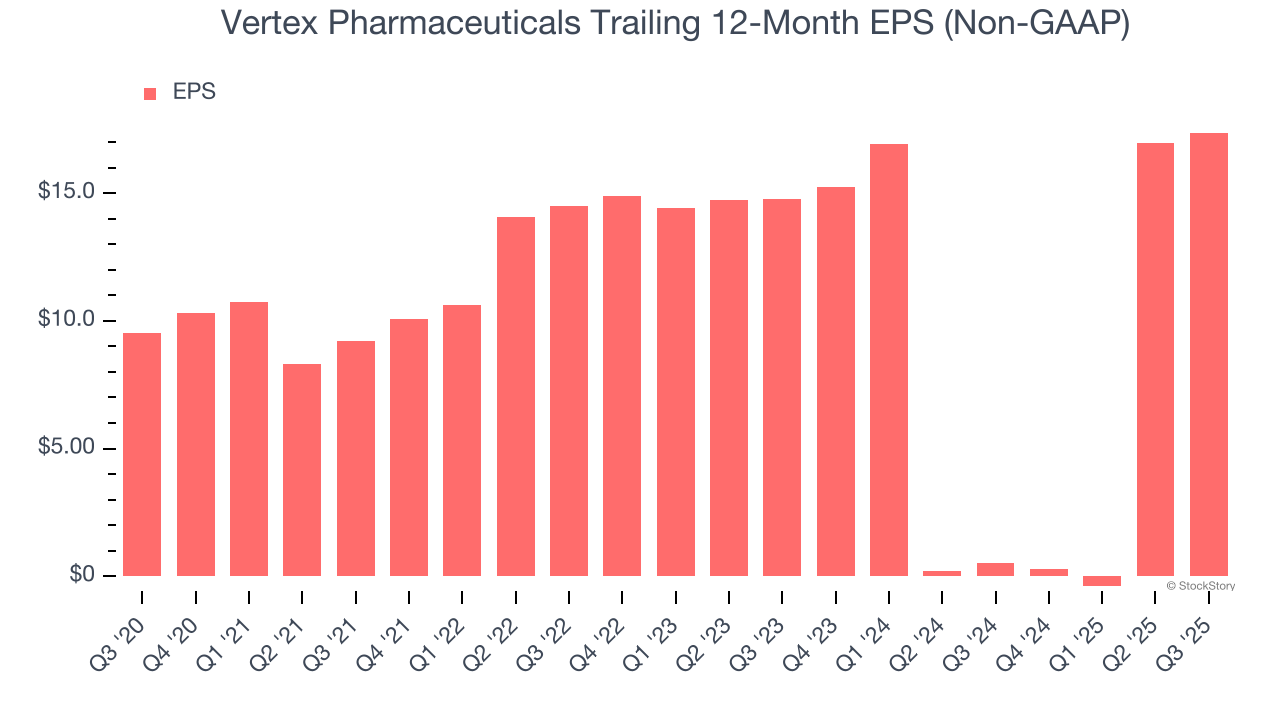
In Q3, Vertex Pharmaceuticals reported adjusted EPS of $4.80, up from $4.38 in the same quarter last year. This print beat analysts’ estimates by 4.9%. Over the next 12 months, Wall Street expects Vertex Pharmaceuticals’s full-year EPS of $17.37 to grow 15.8%.
Key Takeaways from Vertex Pharmaceuticals’s Q3 Results
It was good to see Vertex Pharmaceuticals beat analysts’ EPS expectations this quarter. On the other hand, its full-year revenue guidance was in line. Zooming out, we think this was a mixed quarter. The market seemed to be hoping for more, and the stock traded down 3.8% to $410 immediately after reporting.
So do we think Vertex Pharmaceuticals is an attractive buy at the current price? We think that the latest quarter is only one piece of the longer-term business quality puzzle. Quality, when combined with valuation, can help determine if the stock is a buy. We cover that in our actionable full research report which you can read here, it’s free for active Edge members.