
Over the last six months, Chewy’s shares have sunk to $32.87, producing a disappointing 13.1% loss - a stark contrast to the S&P 500’s 21.3% gain. This might have investors contemplating their next move.
Is there a buying opportunity in Chewy, or does it present a risk to your portfolio? Get the full breakdown from our expert analysts, it’s free for active Edge members.
Why Is Chewy Not Exciting?
Even with the cheaper entry price, we're sitting this one out for now. Here are three reasons why CHWY doesn't excite us and a stock we'd rather own.
1. Long-Term Revenue Growth Disappoints
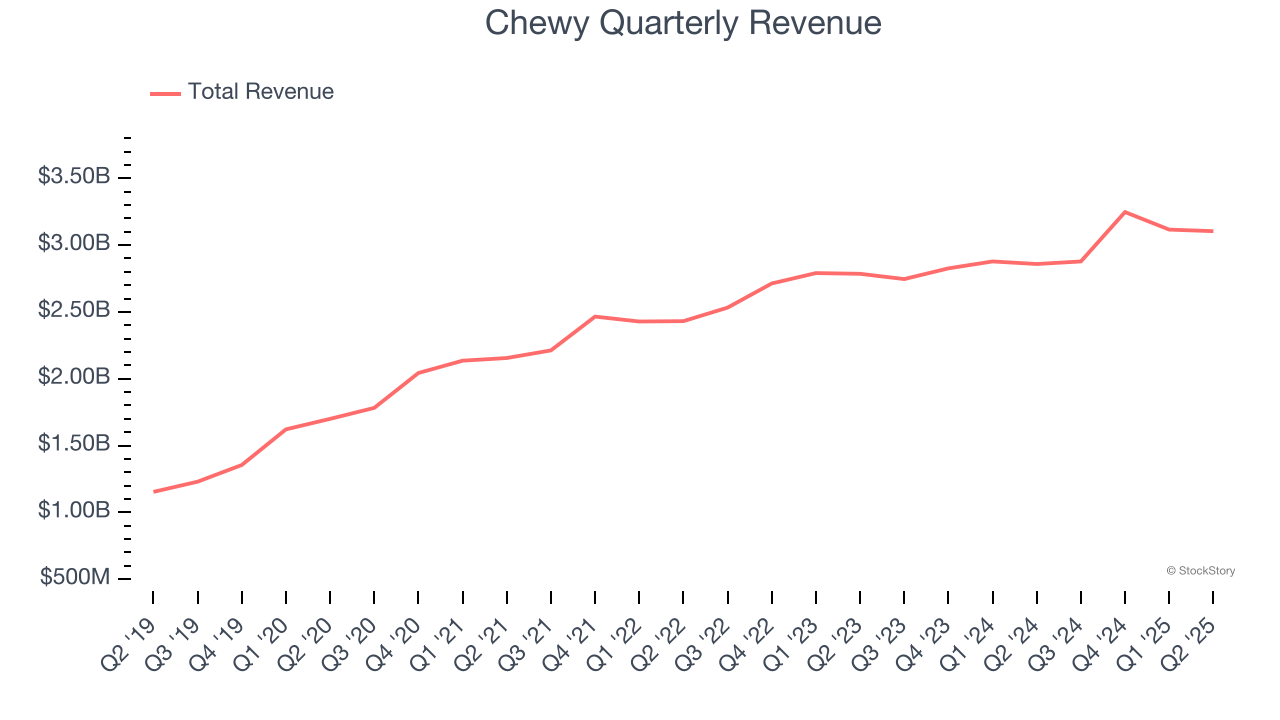
Reviewing a company’s long-term sales performance reveals insights into its quality. Any business can experience short-term success, but top-performing ones enjoy sustained growth for years. Unfortunately, Chewy’s 9% annualized revenue growth over the last three years was mediocre. This was below our standard for the consumer internet sector.
2. Projected Revenue Growth Is Slim
Forecasted revenues by Wall Street analysts signal a company’s potential. Predictions may not always be accurate, but accelerating growth typically boosts valuation multiples and stock prices while slowing growth does the opposite.
Over the next 12 months, sell-side analysts expect Chewy’s revenue to rise by 5.9%, a deceleration versus This projection doesn't excite us and implies its products and services will see some demand headwinds.
3. Low Gross Margin Reveals Weak Structural Profitability
For online retail (separate from online marketplaces) businesses like Chewy, gross profit tells us how much money the company gets to keep after covering the base cost of its products and services, which typically include the cost of acquiring the products sold, shipping and fulfillment, customer service, and digital infrastructure.
Chewy’s unit economics are far below other consumer internet companies because it must carry inventories as an online retailer. This means it has relatively higher capital intensity than a pure software business like Meta or Airbnb and signals it operates in a competitive market. As you can see below, it averaged a 29.2% gross margin over the last two years. That means Chewy paid its providers a lot of money ($70.77 for every $100 in revenue) to run its business. 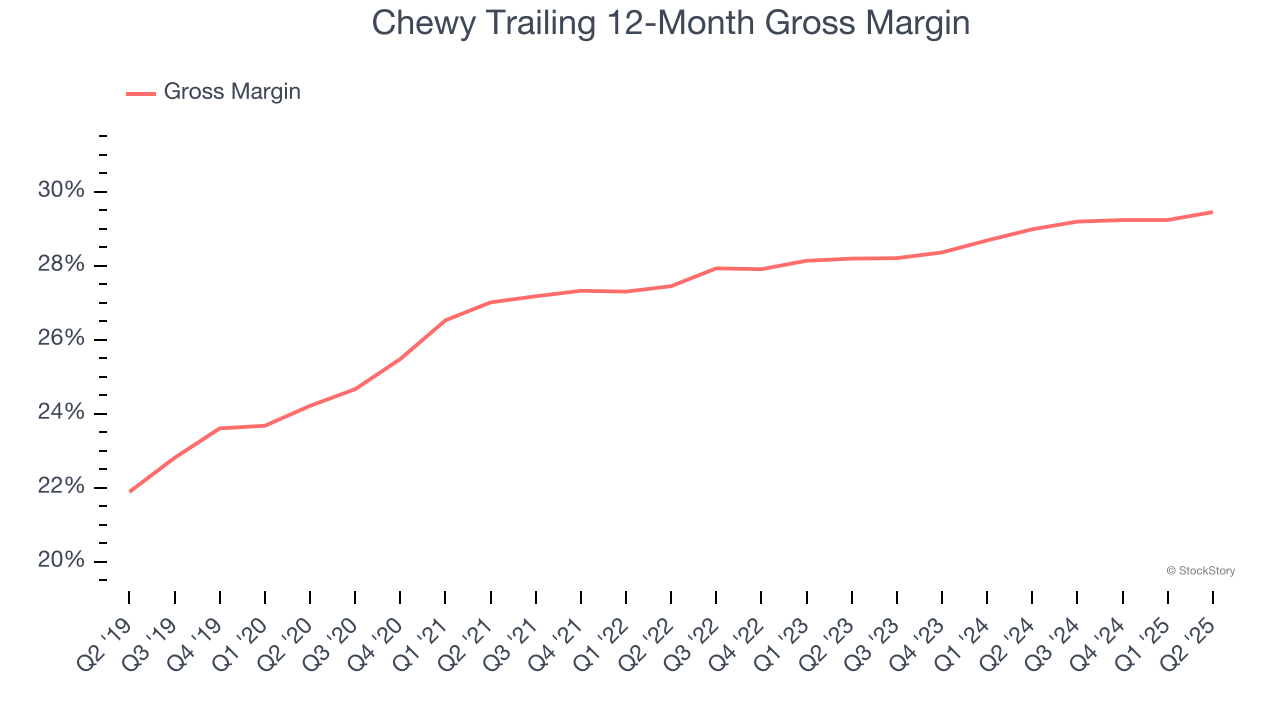
Final Judgment
Chewy isn’t a terrible business, but it isn’t one of our picks. After the recent drawdown, the stock trades at 18× forward EV/EBITDA (or $32.87 per share). This multiple tells us a lot of good news is priced in - we think other companies feature superior fundamentals at the moment. We’d recommend looking at a fast-growing restaurant franchise with an A+ ranch dressing sauce.
High-Quality Stocks for All Market Conditions
Trump’s April 2025 tariff bombshell triggered a massive market selloff, but stocks have since staged an impressive recovery, leaving those who panic sold on the sidelines.
Take advantage of the rebound by checking out our Top 5 Growth Stocks for this month. This is a curated list of our High Quality stocks that have generated a market-beating return of 183% over the last five years (as of March 31st 2025).
Stocks that made our list in 2020 include now familiar names such as Nvidia (+1,545% between March 2020 and March 2025) as well as under-the-radar businesses like the once-micro-cap company Tecnoglass (+1,754% five-year return). Find your next big winner with StockStory today.
StockStory is growing and hiring equity analyst and marketing roles. Are you a 0 to 1 builder passionate about the markets and AI? See the open roles here.


