
Home services online marketplace ANGI (NASDAQ: ANGI) missed Wall Street’s revenue expectations in Q3 CY2025, with sales falling 10.5% year on year to $265.6 million. Its GAAP profit of $0.23 per share was 37.5% below analysts’ consensus estimates.
Is now the time to buy Angi? Find out by accessing our full research report, it’s free for active Edge members.
Angi (ANGI) Q3 CY2025 Highlights:
- Revenue: $265.6 million vs analyst estimates of $268.8 million (10.5% year-on-year decline, 1.2% miss)
- EPS (GAAP): $0.23 vs analyst expectations of $0.37 (37.5% miss)
- Operating Margin: 8.2%, up from 2.6% in the same quarter last year
- Free Cash Flow Margin: 1.8%, down from 16.1% in the previous quarter
- Market Capitalization: $578.7 million
Company Overview
Created by IAC’s mergers of Angie’s List and HomeAdvisor, ANGI (NASDAQ: ANGI) operates the largest online marketplace for home services in the US.
Revenue Growth
A company’s long-term sales performance is one signal of its overall quality. Any business can have short-term success, but a top-tier one grows for years. Angi struggled to consistently generate demand over the last three years as its sales dropped at a 17.2% annual rate. This was below our standards and is a tough starting point for our analysis.
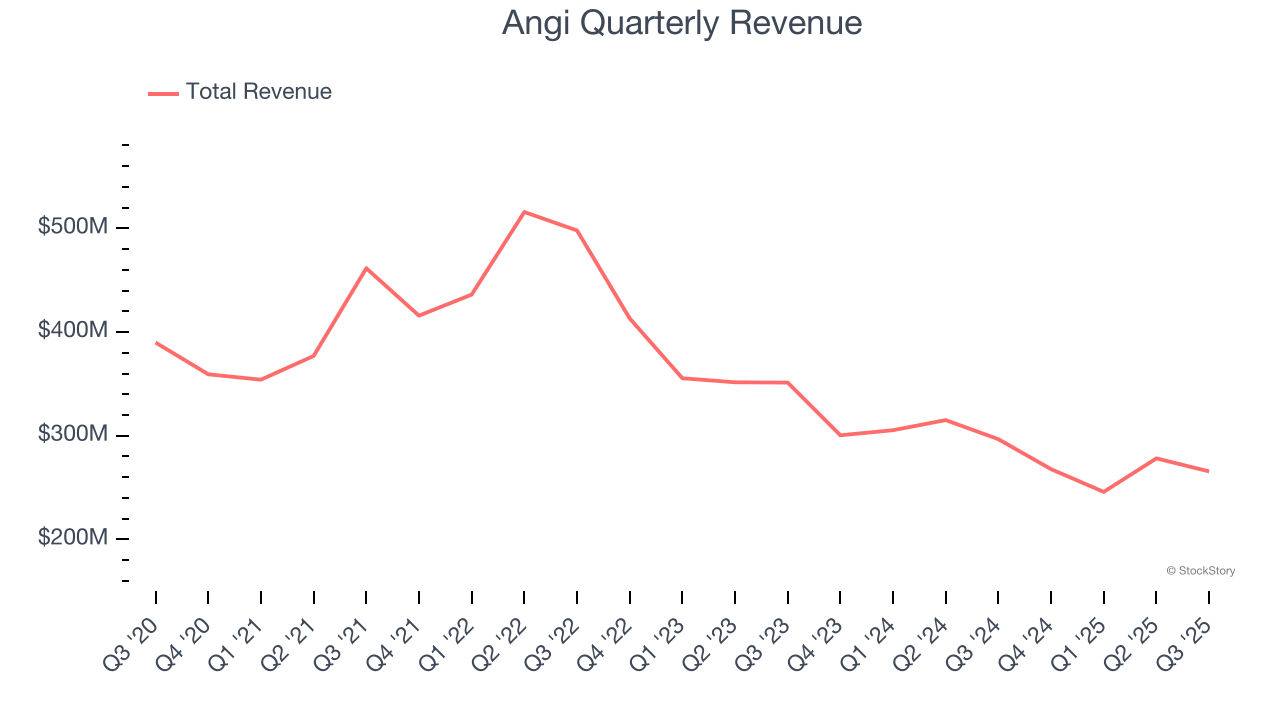
This quarter, Angi missed Wall Street’s estimates and reported a rather uninspiring 10.5% year-on-year revenue decline, generating $265.6 million of revenue.
Looking ahead, sell-side analysts expect revenue to grow 2.2% over the next 12 months. While this projection implies its newer products and services will catalyze better top-line performance, it is still below the sector average.
Software is eating the world and there is virtually no industry left that has been untouched by it. That drives increasing demand for tools helping software developers do their jobs, whether it be monitoring critical cloud infrastructure, integrating audio and video functionality, or ensuring smooth content streaming. Click here to access a free report on our 3 favorite stocks to play this generational megatrend.
Cash Is King
Free cash flow isn't a prominently featured metric in company financials and earnings releases, but we think it's telling because it accounts for all operating and capital expenses, making it tough to manipulate. Cash is king.
Angi has shown decent cash profitability, giving it some flexibility to reinvest or return capital to investors. The company’s free cash flow margin averaged 6% over the last two years, slightly better than the broader consumer internet sector.
Taking a step back, we can see that Angi’s margin expanded by 12.3 percentage points over the last few years. This is encouraging, and we can see it became a less capital-intensive business because its free cash flow profitability rose more than its operating profitability.
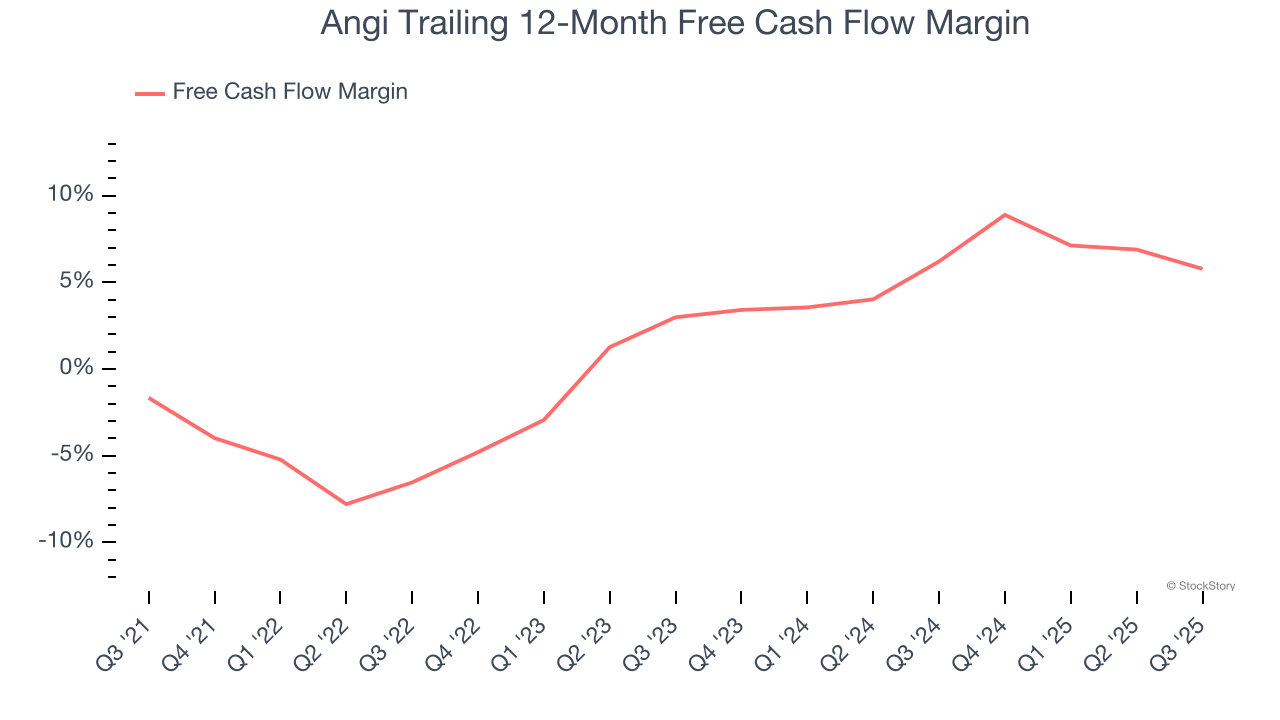
Angi’s free cash flow clocked in at $4.9 million in Q3, equivalent to a 1.8% margin. The company’s cash profitability regressed as it was 4.5 percentage points lower than in the same quarter last year, prompting us to pay closer attention. Short-term fluctuations typically aren’t a big deal because investment needs can be seasonal, but we’ll be watching to see if the trend extrapolates into future quarters.
Key Takeaways from Angi’s Q3 Results
Both revenue and EPS missed. Overall, this was a softer quarter. The stock traded down 12.4% to $11.27 immediately following the results.
Is Angi an attractive investment opportunity right now? The latest quarter does matter, but not nearly as much as longer-term fundamentals and valuation, when deciding if the stock is a buy. We cover that in our actionable full research report which you can read here, it’s free for active Edge members.


