
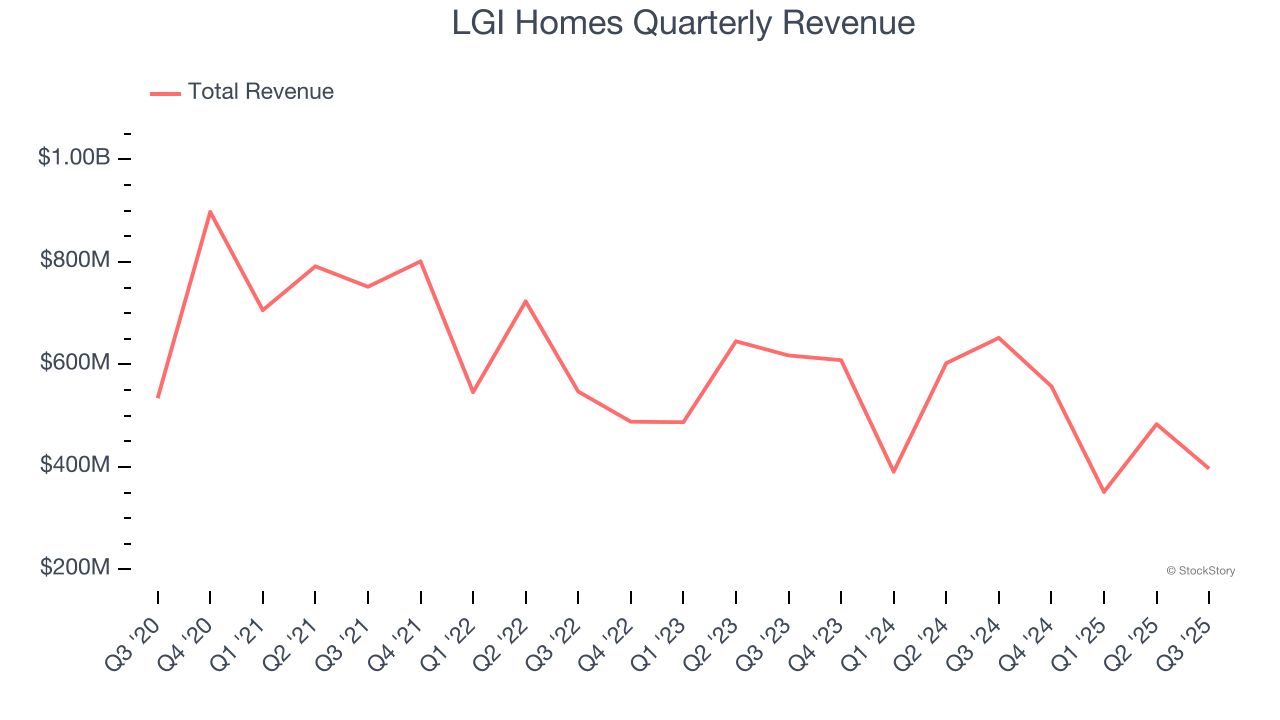
Affordable single-family home construction company LGI Homes (NASDAQ: LGIH) reported Q3 CY2025 results topping the market’s revenue expectations, but sales fell by 39.2% year on year to $396.6 million. Its GAAP profit of $0.85 per share was 9% below analysts’ consensus estimates.
Is now the time to buy LGI Homes? Find out by accessing our full research report, it’s free for active Edge members.
LGI Homes (LGIH) Q3 CY2025 Highlights:
- Revenue: $396.6 million vs analyst estimates of $390.4 million (39.2% year-on-year decline, 1.6% beat)
- EPS (GAAP): $0.85 vs analyst expectations of $0.93 (9% miss)
- Operating Margin: 5.4%, down from 12.3% in the same quarter last year
- Backlog: $498.7 million at quarter end, up 19.4% year on year
- Market Capitalization: $939.1 million
“We are pleased with our third quarter results, which met our stated guidance and reflect the disciplined execution of our teams as we continue to deliver on our strategic objectives,” said Eric Lipar, Chairman and Chief Executive Officer of LGI Homes.
Company Overview
Based in Texas, LGI Homes (NASDAQ: LGIH) is a homebuilding company specializing in constructing affordable, entry-level single-family homes in desirable communities across the United States.
Revenue Growth
A company’s long-term sales performance can indicate its overall quality. Any business can experience short-term success, but top-performing ones enjoy sustained growth for years. LGI Homes’s demand was weak over the last five years as its sales fell at a 2.9% annual rate. This was below our standards and suggests it’s a low quality business.
Long-term growth is the most important, but within industrials, a half-decade historical view may miss new industry trends or demand cycles. LGI Homes’s recent performance shows its demand remained suppressed as its revenue has declined by 10.6% annually over the last two years. 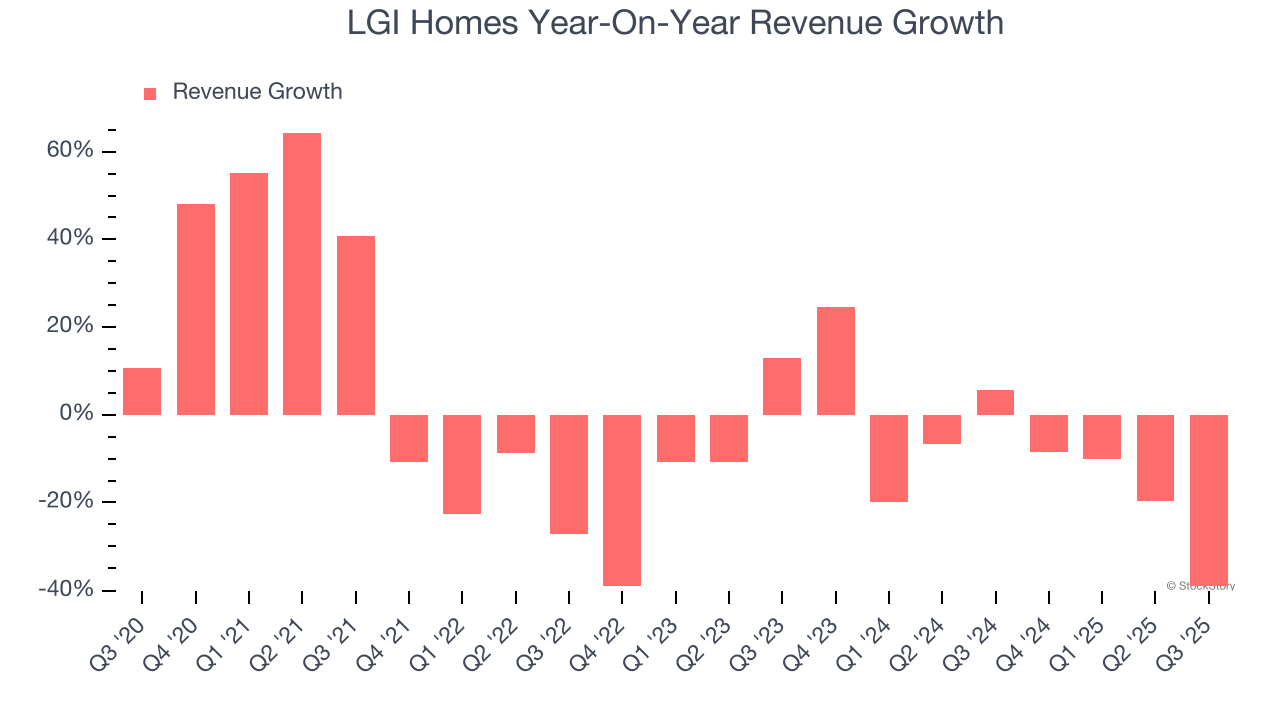
We can dig further into the company’s revenue dynamics by analyzing its backlog, or the value of its outstanding orders that have not yet been executed or delivered. LGI Homes’s backlog reached $498.7 million in the latest quarter and averaged 10.4% year-on-year declines over the last two years. Because this number is in line with its revenue growth, we can see the company effectively balanced its new order intake and fulfillment processes. 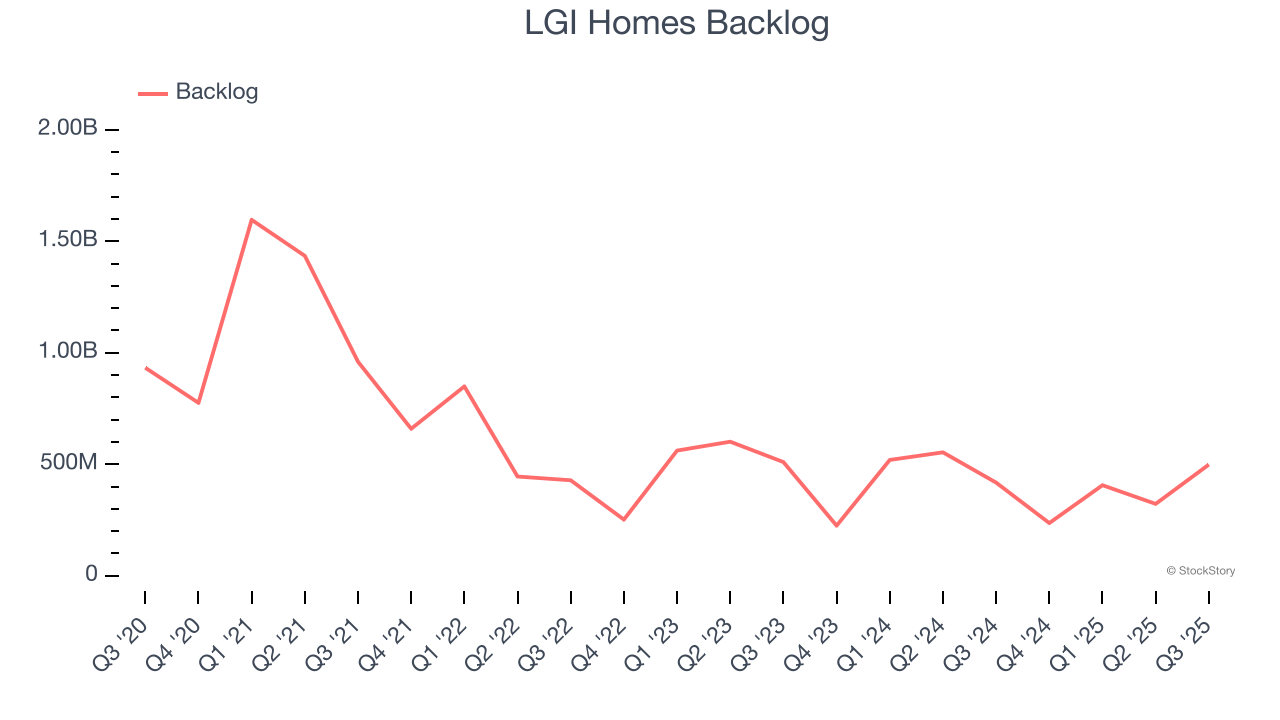
This quarter, LGI Homes’s revenue fell by 39.2% year on year to $396.6 million but beat Wall Street’s estimates by 1.6%.
Looking ahead, sell-side analysts expect revenue to grow 3.1% over the next 12 months. Although this projection indicates its newer products and services will spur better top-line performance, it is still below the sector average.
The 1999 book Gorilla Game predicted Microsoft and Apple would dominate tech before it happened. Its thesis? Identify the platform winners early. Today, enterprise software companies embedding generative AI are becoming the new gorillas. a profitable, fast-growing enterprise software stock that is already riding the automation wave and looking to catch the generative AI next.
Operating Margin
Operating margin is an important measure of profitability as it shows the portion of revenue left after accounting for all core expenses – everything from the cost of goods sold to advertising and wages. It’s also useful for comparing profitability across companies with different levels of debt and tax rates because it excludes interest and taxes.
LGI Homes has been an efficient company over the last five years. It was one of the more profitable businesses in the industrials sector, boasting an average operating margin of 13.4%. This result was particularly impressive because of its low gross margin, which is mostly a factor of what it sells and takes huge shifts to move meaningfully. Companies have more control over their operating margins, and it’s a show of well-managed operations if they’re high when gross margins are low.
Looking at the trend in its profitability, LGI Homes’s operating margin decreased by 12.2 percentage points over the last five years. Even though its historical margin was healthy, shareholders will want to see LGI Homes become more profitable in the future.
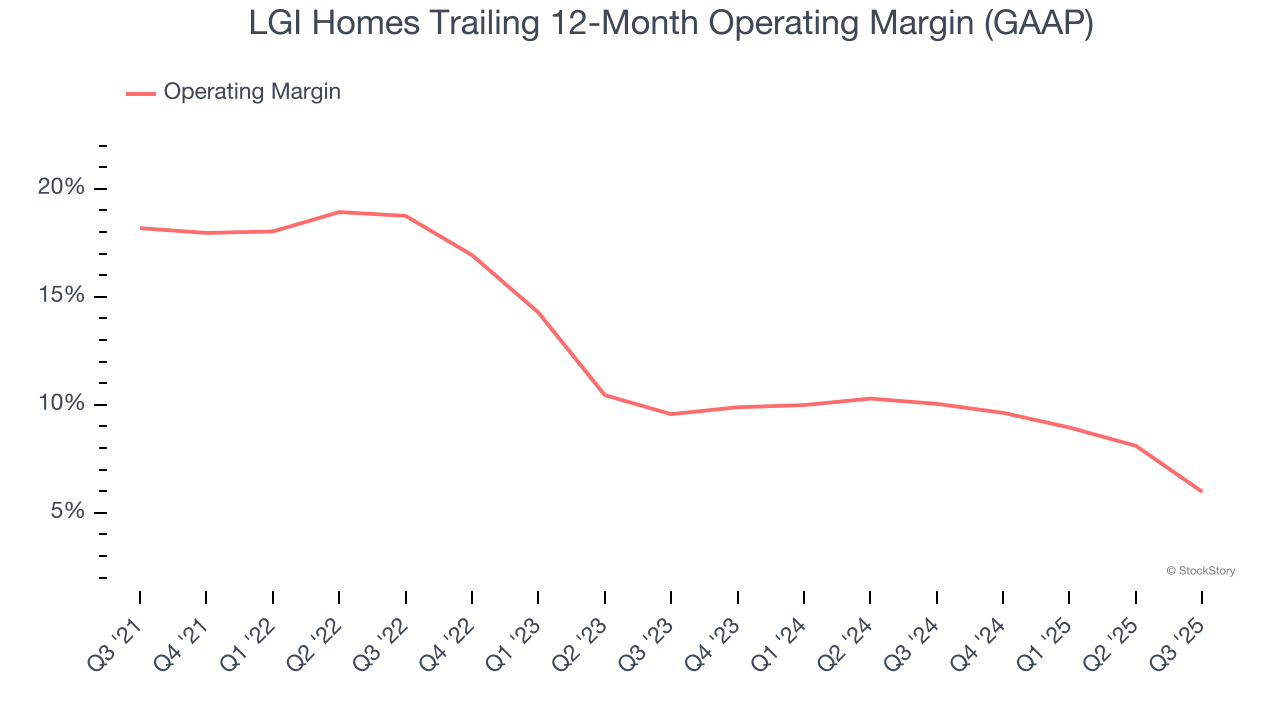
In Q3, LGI Homes generated an operating margin profit margin of 5.4%, down 6.9 percentage points year on year. Since LGI Homes’s operating margin decreased more than its gross margin, we can assume it was less efficient because expenses such as marketing, R&D, and administrative overhead increased.
Earnings Per Share
Revenue trends explain a company’s historical growth, but the long-term change in earnings per share (EPS) points to the profitability of that growth – for example, a company could inflate its sales through excessive spending on advertising and promotions.
Sadly for LGI Homes, its EPS declined by 14.5% annually over the last five years, more than its revenue. This tells us the company struggled because its fixed cost base made it difficult to adjust to shrinking demand.
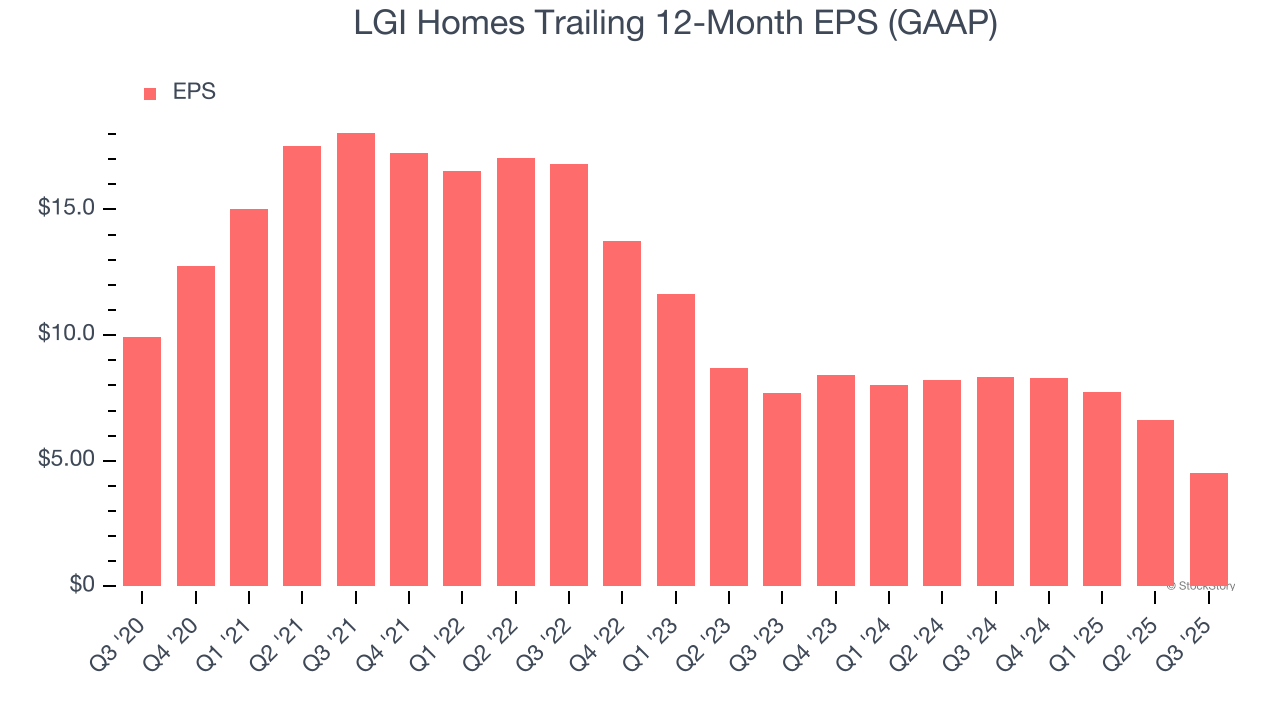
Diving into the nuances of LGI Homes’s earnings can give us a better understanding of its performance. As we mentioned earlier, LGI Homes’s operating margin declined by 12.2 percentage points over the last five years. This was the most relevant factor (aside from the revenue impact) behind its lower earnings; interest expenses and taxes can also affect EPS but don’t tell us as much about a company’s fundamentals.
Like with revenue, we analyze EPS over a shorter period to see if we are missing a change in the business.
For LGI Homes, its two-year annual EPS declines of 23.2% show it’s continued to underperform. These results were bad no matter how you slice the data.
In Q3, LGI Homes reported EPS of $0.85, down from $2.95 in the same quarter last year. This print missed analysts’ estimates. Over the next 12 months, Wall Street expects LGI Homes’s full-year EPS of $4.53 to shrink by 4.4%.
Key Takeaways from LGI Homes’s Q3 Results
It was encouraging to see LGI Homes beat analysts’ revenue expectations this quarter. On the other hand, its EPS missed and its backlog fell slightly short of Wall Street’s estimates. Overall, this was a softer quarter. The stock remained flat at $41.01 immediately following the results.
So do we think LGI Homes is an attractive buy at the current price? What happened in the latest quarter matters, but not as much as longer-term business quality and valuation, when deciding whether to invest in this stock. We cover that in our actionable full research report which you can read here, it’s free for active Edge members.


